Download
1 / 55
550 likes | 623 Views
Using Existing ITS Commercial Vehicle Operation (ITS/CVO) Data to Develop Statewide (and Bi-state) Truck Travel Time Estimates and Other Freight Measures. Christopher M. Monsere TAC Meeting June 29, 2009 1:00-3:30PM. Agenda. Objectives.

E N D
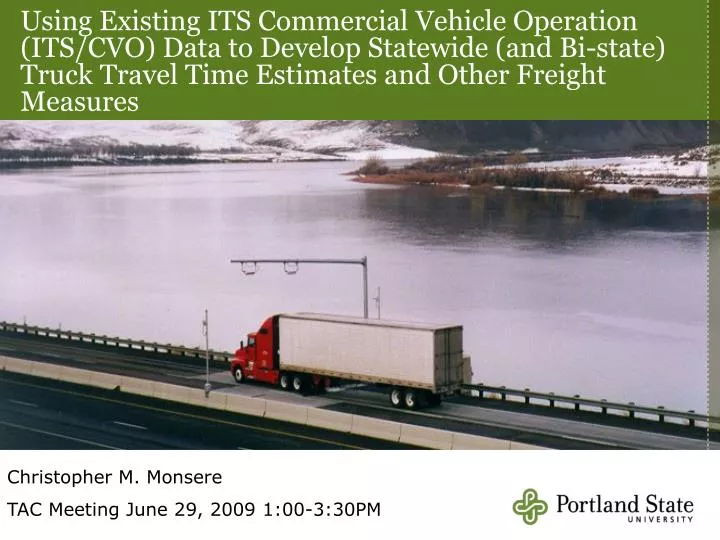
Using Existing ITS Commercial Vehicle Operation (ITS/CVO) Data to Develop Statewide (and Bi-state) Truck Travel Time Estimates and Other Freight Measures Christopher M. Monsere TAC Meeting June 29, 2009 1:00-3:30PM
Objectives • Retrospectively study truck transponder data in key corridors to determine the feasibility of producing freight corridor performance measures. • Study the feasibility of using transponder data from commercial vehicles to predict corridor travel times with existing infrastructure • Demonstrate other freight performance measures
Data Almanac • 22 (20) reporting WIM sites in Oregon • All upstream of weigh stations • All are CVISN sites • PSU WIM Data Archive • April 2005 – February 2009 • 41,534,800 + trucks • Data quality • Intermittent data outages and problems • Accuracy ? • Focus of other research project
Axle weights • Gross vehicle weight • Axle spacing • Vehicle class • Bumper-to-bumper length • Speed • Unique transponder numbers WIM Layout Trucks Bypass R.F. Antenna 1 mile Notification Station (in-cab) High Speed Tracking System WIM Sorting Site Ramp (with Overhead AVI) Static Sorter Weighing System
Estimating Truck Travel Times • Matching transponders • Filtering through trucks • Results • Discussion
Defining Links • At each station, find all possible downstream stations. • Calculate shortest path between stations • Three categories • Primary • Route certain, one highway • Secondary • Route certain, more than 1 highway • Tertiary • Route uncertain
201 – FWB to EMH Free flow travel time = Distance / 55 mph = 126.4 mi / 55 mph = 2.3 hrs Search window = 2.3 *.75 = 1.7 hrs (74 mph) 2.3 * 2 = 4.6 hrs (27 mph)
Filter Algorithm • For each truck j traveling on link i determine the estimated travel time, tj,i. • If the travel time tj,i is less than the free-flow time ffj,idenote this truck as a through truck. • If the travel time tj,i is less than the upper travel time utj,i (defined as an average travel time of 50 mph). • Find the median travel time mtj,i in the sample of X previous truck observations and compare that to tj,i. If tj,i does not exceed mtj,i by a threshold of Y, truck j is assumed to be a through vehicle. • If none of the above criteria are met, the tj,iis excluded (i.e., j is not a through truck).
201 – FWB to EMH Ladd Summit RWIS El 3619 ft Pendleton NOAA El 1493 ft
Results min 1000 obs
Results min 500 obs
Ground Truth Comparison • Questions • Can trucks estimate car travel times? • Are the truck matched times “reasonable”? • Method • State motor pool fleet • Low power GPS data logger Sample Data Tag,$GPGGA,UTC(hhmmss.sss),Latitude,N/S,Longitude,E/W,Fix quality,Number Of Satellites,Horizontal dilution of position,Altitude,Height of geoid,,Checksum Tag,$GPRMC,UTC(hhmmss.sss),A,Latitude,N/S,Longitude,E/W,Speed(knots),Course(degrees),Date(ddmmyy),,Checksum ---,$GPGGA,162807.000,3205.5748,S,11548.6228,E,1,46,226.6,7990.0,M,00.0,M,,*73 ---,$GPRMC,162807.000,A,3205.5748,S,11548.6228,E,0.00,46.00,080800,,*2B ---,$GPGGA,162807.000,3205.5749,S,11548.6228,E,1,46,226.6,8502.0,M,00.0,M,,*7A
Sample Mapped GPS data HH:MM:SS HH:MM:SS
Discussion • Real time traveler information • Long term corridor performance • Data quality
Real time traveler information • Incidents and weather typical delays • Probe data confirms trucks behave differently than cars • Distance between stations • no vehicle conservation • increased in variability of travel times • latency in information • sensitivity of filter governs minimum incident that can be detected • Number of matches • See handout
Real time traveler information • Solve the spacing issue? • Additional tag readers ($9,000) • Where to place? • Junctions and other known delay areas • Minimum incident duration, link parameters • Still have trucks not like cars, especially winter • Still have data quality issues • Other approaches • MAC address matching • More passenger cars • Same issues
Long term corridor performance • Appears feasible • Sufficient number of matches • Average speeds and standard deviations easily calculated • Long distance not as problematic • Able to detect some disturbances • Additional readers at key locations could help with patterns • Work on data quality
Data quality • Generally, good • Outages • Planned/unplanned • Sensor error or drift • Weight • Timestamp • Could be addressed
Other Freight Performance Measures • Station level • Metrics produced from this category do not leverage the transponder information. These are traditional metrics that can be extracted from a WIM data source • Matched trucks • These are truck-pairs on each link observed within a window (not necessarily through trucks) • Filtered matched truck data • Travel time was the key measure (already presented)
Station Level • Counts of Trucks • Gross Vehicle Weight and Payload Estimate • Percentage of Trucks with Transponders • Overweight Vehicles • Observed Truck Speed
Matched Truck Data • Estimated Freight Activity on Corridor • Freight Patterns • Ton Miles • Emissions
Freight Activity Production About 1600 more truckloads consumed Consumption