Download
1 / 73
770 likes | 1.03k Views
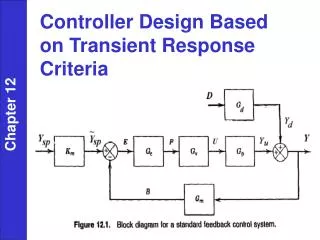
Assessment of the DCLL TBM Failure Modes based on ITER Design Criteria. Shahram Sharafat , Aaron Aoyama, Nasr Ghoniem (UCLA). Fusion Nuclear Science and Technology Annual Meeting, August 2 – 4, 2010 UCLA Rice Conference Room, 6764 Boelter Hall. INTRODUCTION.

E N D
Assessment of the DCLL TBM Failure Modes based on ITER Design Criteria ShahramSharafat, Aaron Aoyama, Nasr Ghoniem (UCLA) Fusion Nuclear Science and Technology Annual Meeting, August 2 – 4, 2010 UCLA Rice Conference Room, 6764 Boelter Hall
INTRODUCTION • The DCLL TBM is a safety-critical structure, which operates under low- and heavy loading conditions (normal- and off-normal). • Under normal operating conditions plastic deformation (shake down) will occur, the TBM structure will undergo loss of ductility ( ̴3.7 dpa EOL), … many potential failure modes exist. • Stress analysis alone cannot predict failures* by buckling, global and/or local collapse, incremental collapse (ratcheting), creep-fatigue, etc. *see backup slides
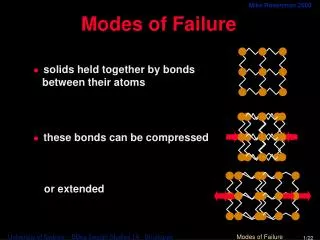
Failure Mechanisms LOW TEMPERATURE: Limit load collapse, under a single load application. Excessive displacement and/or deformation, limiting functionality, under a single load application, below the limit load. Structural instability or buckling, under a single load application. Progressive collapse by ratcheting under cyclic load. Fracture by the initiation and/or propagation of a crack under a single load application. Fatiguefailure under cyclic loading. Breach of the pressure boundary, or structural collapse caused by corrosion induced loss of section. HIGH TEMPERATURE: Excessive deformation - loss of functionality, due to creep deformation under essentially steady load. Creep buckling - time dependent structural instability leading to catastrophic collapse or loss of function. Cyclically enhanced creep deformation (Creep Ratcheting) - Accelerated creep deformation caused by repeated resetting of stresses by cyclic plastic strain, due to cyclic loads superimposed on a sustained load history. Accelerated creep rupture - Accelerated creep damage caused by repeated resetting of stresses by cyclic plastic strain, due to cyclic loads superimposed on a sustained load history. Creep/fatigue interaction - Failure under cyclic conditions in a period, usually less than fatigue due to the cyclic condition alone, or creep rupture due to time-at-stress alone, the mechanism for which may include other time/temperature related phenomena, such as oxide layer cracking, and may be material specific. ALL TEMPERATURES: Corrosion, oxidation, and mass transport phenomena Irradiation induced failure mechanisms
INTRODUCTION • The DCLL TBM is a safety-critical structure, which operates under low- and heavy loading conditions (normal- and off-normal). • Under normal operating conditions plastic deformation (shake down) will occur, furthermore the TBM structure will undergo loss of ductility ( ̴3.7 dpa EOL)… • Stress analysis alone cannot predict failures* by buckling, global and/or local collapse, incremental collapse (ratcheting), creep-fatigue, etc. • Fortunately, general purpose FEM codes can be used to evaluate performance of loaded structures in compliance with “Design Criteria” rules. • Design Criteria rules offer tools for assessing the performance of loaded structures by means of limit and shakedown analysis methods of “Design By Analysis” (DBA). • Ultimately, design of robust and reliable TBM structures requires sensitivity studies that: • combine DBA analyses with probabilistic methods, and • perform large-scale FEM analyses with the inclusion of hardening and damage. *see backup slides
TALK OUTLINE Structural Evaluation Plan (SEP) – Flow of Design Analysis Definition of SDC-IC Design Criteria F82H material property data for SDC-IC Large-scale FEM analysis of the DCLL TBM Selecting paths (total of 13) through critical locations of the DCLL TBM structure Application of low- and high temperature SDC-IC rules to the 13 paths. Tabulated Factor-of-Safety (FoS) of all 13 paths for both un-irradiated and irradiated operating conditions.
Structural Evaluation Plan (SEP) • Basic Design Configuration: Sufficient analysis to establish basic shapes and sizes for interfacing with other components. • Deformation Limits & Functional Requirements: Identify deformation limits and functional requirements established by the manufacturer for proper performance. • Structural Evaluation: • Failure Modes: Identify location of dominant failure modes and load conditions (pressure, thermal, seismic, etc.). • Screening Analysis: Make a preliminary evaluation of the adequacy of the design. • Typical screening analysis consist of an initial linear elastic analysis, comparison with design limits adjusted to account for significant fabrication and environmental effects. • Detailed Inelastic Analysis: After Screening Analysis is complete. • Support Test Program for Component Design Analysis: Manufacturer should identify structural tests required in support of design analysis.
Sample Screening Analysis Design Specifications Initial Design Design Iteration Elastic Analysis Design Criteria Met Report to Owner YES NO Design Iterations Simplified Inelastic Anal. NO Design Criteria Met Report to Owner YES NO NO Proposal for Supporting Test Program Proposal for Detailed Inelastic Analysis
Screening Analysis Reported Here Design Specifications Initial Design Design Iteration Elastic Analysis Flow Chart(next slide) Design Criteria Met Report to Owner YES NO Design Iterations Simplified Inelastic Anal. NO Design Criteria Met Report to Owner YES NO NO Proposal for Supporting Test Program Proposal for Detailed Inelastic Analysis
Analysis Flow Chart for Low-Temperature SDC-IC Design Rules for Given Operating Conditions • Brittle Fracture: KI = stress intensity factor (a =h/4), • 3Sm ratcheting due to cyclic loading limit • PM+Pb/K = creep damage limit • PL = Imm. Plastic collapse and plastic instabiliy • PL+QL = Plastic Flow Localization • PL + PB + Q + F = ductility exhaustion limit
Some Terminology • PRIMARY AND SECONDARY STRESS: • “Primary” stress denotes that part of the total stress in equilibrium with external mechanical forces (pressure). • “Secondary” stress consists of all contributions to an internal, self equilibrating or residual stress state (thermal stress). • Primary stress is instrumental in causing gross structural collapse whereas the secondary stress is of concern for cyclic load or local damage accumulation. • HIGH TEMPERATURE: • “High temperature” refers to the operating range of temperature within which time dependent, thermally activated deformation and damage processes occur. • “High temperature” is, for the most part synonymous with “in the creep range”, but others, such as thermal ageing and oxidation/ corrosion are also important.
Schematic Diagram of ASME Design Stress Determination High Temperature Regime Low Temperature Regime
Loading Category Criteria Level • Level A and C loadings include electromagnetic loading during plasma disruptions. • Level D postulates earthquakes. • Level A Design Criteria prevent against: • immediate plastic collapse, • immediate plastic instability, • Immediate plastic flow localization, • fast fracture, • local fracture due to exhaustion of ductility, • ratcheting, • fatigue, • thermal creep, • buckling
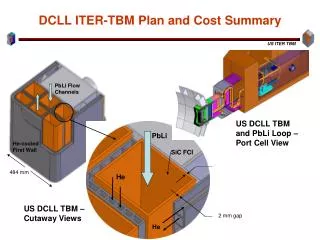
Thermo-mechanical Modeling of TBM • Solid Modeling of 2009 – 2010 TBM : • Used Original CATIA TBM Model • Created solid bodies for He & PbLi volumes • Total of 91 solid bodies were assembled into the TBM Solid Model before importing it into ANSYS for meshing and analysis (including Flexible Joints) • Thermo-mechanical Loads: • Gravity (account for PbLi weight) • Uniform FW surface heat flux (q” = 0.5 MW/m2) • He-pressure: 8 MPa; PbLi pressure: 2 MPa • Convective cooling (location dependent) • Volumetric heating (material & location dependent) He-Solid Body (assembled) Exploded View of He-Solid Bodies (temperature coded)
Thermal Analysis: Temperatures poloidal Tmax=560 oC radial toroidal Tmax = 560 oC at top of FW ~550 oC ~507 oC ~495 oC FW radial BW
Based on ITER FW Flexible Joint Structural Analysis: Stress • Von Mises stress contours Side Veiw Top View(TBM Lid) Flexible Joint Detail
CHOOSING PATHS ALONG CRITICAL LOCATIONS:(1) Highest Stress(2) Midsection of FW (3) Coldest Structure
Path through highest stress location 0.4 m 0.6 m 0.2 m 1.6 m
Cross Section Cut through the TBM (mid-plane) Zooming in on Regionwith Highest Stress
Cross Section Cut through the TBM Mid-plane TBM Lid (top of TBM) Regionwith Highest Stress FW (Plasma side)
Path through the Mid-section of the TBM FW Zooming in on the TBM Midsection -FW
Choosing a Path through TBM Structure with Lowest Temperature
Path through the Coldest Structure Zooming in on the TBM Coldest Structure: He-Inlet
Path through the Coldest Structure of the TBM He-Inlet Duct to TBM
(Temperature and irradiation damage dependent) F82h material property Data: q is temperature in oC
Image Set 1: Linearization Example Linearizing Stress along the paths.
Stress along path near top of TBM Membrane plus Bending plus Non-linear
TBM Design Criteria Stress Results Path Average Temperatures In order to properly determine the material properties to compare our stress results to, temperature data was collected along each of the 13 paths. Average temperatures along each path were determined, and using the correlations, material property data was calculated accordingly. Se: allowable total stress intensity; Sd: allowable total membrane plus bending stress intensity
SUMMARY • SDC-IC Design Rules were reviewed and F82H material properties were collected and extrapolated for SDC-IC (including KIC) • Large-scale FEM analysis of the DCLL TBM stress results were broken down into membrane, bending, and total stress along 13 different paths through the TBM structure. • Low- and high temperature SDC-IC rules were applied to the paths. • Normal operating loading based Factor-of-Safety (FoS) for both un-irradiated and irradiated materials show that : • DCLL structural design satisfies all SDC-IC design criteria for normal operation for irradiated (3.7 dpa) material properties • The FoS for “Plastic Flow Localization Limit” is less then 1 for at the FW near the top of the TBM (Path 1). • An inelastic analysis would have to be performed to demonstrate that stress relaxation due to local deformation reduces the membrane plus bending stress along Path 1 to acceptable levels.