Download

1 / 34
340 likes | 342 Views
Learn how to construct and interpret stem-and-leaf plots with examples and step-by-step instructions. Analyze data, find range, median, and mode.

E N D
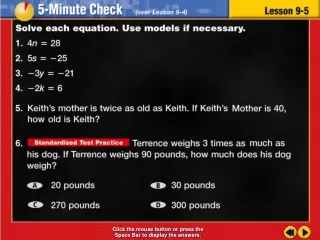
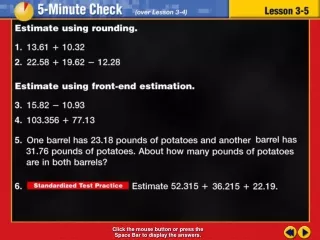
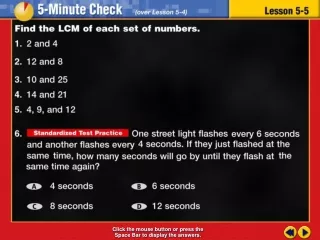
Transparency 5 Click the mouse button or press the Space Bar to display the answers.
Example 5-2b Objective Construct and interpret stem-and-leaf plots
Example 5-2b Vocabulary Stem-and-leaf plot Data is organized from least to greatest and placed in a t-chart
Example 5-2b Vocabulary Leaf The digits of the least place value of the data set Leaf
Example 5-2b Vocabulary Stem The larger place value digits Stem
Lesson 5 Contents Example 1Construct a Stem-and-Leaf Plot Example 2Analyze Data Example 3Make Conclusions About Data
Home Runs 0 54 25 46 4 59 47 41 3 35 60 34 2 41 54 6 11 22 46 29 46 49 Source: baberuth.com Example 5-1a BASEBALLThe table below shows the number of home runs that Babe Ruth hit during his career from 1914 to 1935. Make a stem-and-leaf plot of the data. Order the data from least to greatest. Begin with the smallest number which is 0 49, 0, 2, 3, 11, 41, 22, 41, 25, 46, 29, 46, 4, 34, 46, 6, 35, 47, 54, 54, 59, 60 1/3
Example 5-1a 0, 2, 3, 4, 6, 11, 22, 25, 29, 34, 35, 41, 41, 46, 46, 46, 47, 49, 54, 54, 59, 60 Draw a stem-and-leaf frame which includes a horizontal line 1/3
Example 5-1a 0, 2, 3, 4, 6, 11, 22, 25, 29, 34, 35, 41, 41, 46, 46, 46, 47, 49, 54, 54, 59, 60 Label headings with “Stem” on the left and “Leaf” on the right Stem Leaf 1/3
Example 5-1a 0, 2, 3, 4, 6, 11, 22, 25, 29, 34, 35, 41, 41, 46, 46, 46, 47, 49,54, 54, 59,60 The stem is the beginning place value of the number Notice most of the numbers have 2 digits so the stem will be the tens place value Stem Leaf 0 Tens place value of one digit numbers is zero (0) 1/3
Example 5-1a 0, 2, 3, 4, 6, 11, 22, 25, 29, 34, 35, 41, 41, 46, 46, 46, 47, 49,54, 54, 59,60 The next group of numbers have a 1 in the ten’s place Continue with each place value until the end number Stem Leaf 0 1 2 3 4 5 6 1/3
Example 5-1a 0, 2, 3, 4, 6, 11, 22, 25, 29, 34, 35, 41, 41, 46, 46, 46, 47, 49,54, 54, 59,60 The leaf is the one’s place value digit Across from the “0” in the stem, put all the numbers in the 0’s group Stem Leaf 0 0, 2, 3, 4, 6 1 2 3 4 5 6 1/3
Example 5-1a 0, 2, 3, 4, 6, 11, 22, 25, 29, 34, 35, 41, 41, 46, 46, 46, 47, 49,54, 54, 59,60 Across from the “1” in the stem, put all the numbers in the 10’s group Across from the “2” in the stem, put all the numbers in the 20’s group Stem Leaf 0 0, 2, 3, 4, 6 1 1 2 2, 5, 9 3 4 5 6 1/3
Example 5-1a 0, 2, 3, 4, 6, 11, 22, 25, 29, 34, 35, 41, 41, 46, 46, 46, 47, 49,54, 54, 59,60 Across from the “3” in the stem, put all the numbers in the 30’s group Across from the “4” in the stem, put all the numbers in the 40’s group Stem Leaf 0 0, 2, 3, 4, 6 1 1 2 2, 5, 9 3 4, 5 4 1, 1, 6, 6, 6, 7, 9 5 6 1/3
Example 5-1a 0, 2, 3, 4, 6, 11, 22, 25, 29, 34, 35, 41, 41, 46, 46, 46, 47, 49,54, 54, 59,60 Make a key for the stem-and-leaf plot Choose a stem number then write “Key” then the stem Place a vertical line to the right of the stem number Choose a leaf value on the same row as the key Stem Key Key 2 Key 2 5 Leaf 0 0, 2, 3, 4, 6 1 1 2 2, 5, 9 3 4, 5 4 1, 1, 6, 6, 6, 7, 9 5 4, 4, 9 6 0 1/3
Example 5-1a 0, 2, 3, 4, 6, 11, 22, 25, 29, 34, 35, 41, 41, 46, 46, 46, 47, 49,54, 54, 59,60 Answer: Stem Key 2 5 = 25 Key Key 2 Key 2 5 Leaf 0 0, 2, 3, 4, 6 1 1 2 2, 5, 9 3 4, 5 4 1, 1, 6, 6, 6, 7, 9 5 4, 4, 9 6 0 1/3
Hours Aboard an Airplane 4 18 0 23 12 7 9 35 14 6 11 21 19 6 15 26 9 0 13 22 10 Example 5-1b BUSINESSThe table below shows the number of hours spent aboard an airplane for a survey of business men and women. Make a stem-and-leaf plot of the data. 1/3
Answer: Stem Leaf Key 1|3 = 13 hours 0 0 0 4 6 6 7 9 9 1 0 1 2 3 4 5 8 9 2 1 2 3 6 3 5 Example 5-1b 1/3
2|5 = 25 miles Stem Leaf 0 5 5 5 6 1 0 0 0 0 1 2 2 5 8 8 9 2 1 2 5 8 3 0 Example 5-2a FITNESSThe stem-and-leaf plot below shows the number of miles that Megan biked each day during July. Find the range, median, and mode of the data. Range = greatest - least Range = 30 - 5 Subtract Range = 25 miles 2/3
Example 5-2a 2|5 = 25 miles Stem Leaf 0 5 5 5 6 1 0 0 0 0 1 2 2 5 8 8 9 2 1 2 5 8 3 0 FITNESSThe stem-and-leaf plot below shows the number of miles that Megan biked each day during July. Find the range, median, and mode of the data. 2/3
Example 5-2a 2|5 = 25 miles Stem Leaf 0 5 5 5 6 1 0 0 0 0 1 2 2 5 8 8 9 2 1 2 5 8 3 0 Order the numbers from least to greatest Count how many numbers there are 20 numbers Divide 20 by 2 since median is the middle Underline the first 10 numbers Underline the last 10 numbers 5, 5, 5, 6, 10, 10, 10, 10, 11, 12, 12, 15, 18, 18, 19, 21, 22, 25, 28, 30 2/3
Example 5-2a 2|5 = 25 miles Stem Leaf 0 5 5 5 6 1 0 0 0 0 1 2 2 5 8 8 9 2 1 2 5 8 3 0 There are 2 middle numbers Find the mean of the 2 middle numbers However, since the numbers are the same then 12 is the median Median = 12 5, 5, 5, 6, 10, 10, 10, 10, 11, 12, 12, 15, 18, 18, 19, 21, 22, 25, 28, 30 2/3
Example 5-2a Stem Leaf 2|5 = 25 miles 0 5 5 5 6 1 0 0 0 0 1 2 2 5 8 8 9 2 1 2 5 8 3 0 FITNESSThe stem-and-leaf plot below shows the number of miles that Megan biked each day during July. Find the range, median, and mode of the data. Mode = Number(s) that occur most often 3 5’s 4 10’s Mode = 10 2/3
Example 5-2a Answer: Range = 25 miles Median = 12 miles Mode = 10 miles Make sure you put in your dimensional analysis 2/3
Leaf Stem 1|2 = 12 inches 1 3 5 7 9 0 0 0 0 2 4 4 7 8 1 2 6 2 Example 5-2b SNOWFALLThe stem-and-leaf plot below shows the number of inches of snow that fell in Hightown during the month of January for the past 15 years. Find the range, median, and mode. Answer:Range = 25 inches; Median = 10 inches; Mode = 10 inches 2/3
Animal Years Animal Years Animal Years Baboon 20 Chipmunk 6 Guinea Pig 4 Black Bear 18 Cow 15 Horse 20 Polar Bear 20 Deer 8 Mouse 3 Camel 12 Dog 12 Squirrel 10 Cat 12 Elephant 40 Tiger 16 Chimpanzee 20 Giraffe 10 Zebra 15 Example 5-3a ANIMALSThe table shows the average life span of several animals. Make a stem-and-leaf plot of the data. Then use it to describe how the data are spread out. Order numbers in order from least to greatest 3, 4, 6, 8, 10, 10, 12, 12, 12, 15, 15, 16, 18, 20, 20, 20, 20, 40 3/3
Stem Leaf Example 5-3a 3, 4, 6, 8, 10, 10, 12, 12, 12, 15, 15, 16, 18, 20, 20, 20, 20, 40 Make stem-and-leaf frame and label 3/3
Stem Leaf 0 1 2 3 4 Example 5-3a 3, 4, 6, 8, 10, 10, 12, 12, 12, 15, 15, 16, 18 20, 20, 20, 20, 40 3, 4, 6, 8, 10, 10, 12, 12, 12, 15, 15, 16, 18, 20, 20, 20, 20, 40 Make your stem numbers in which will be the 10’s place value Make your leaf with each stem 3 4 6 8 0 0 2 2 2 5 5 6 8 0 0 0 0 0 3/3
Stem Leaf 0 1 0 0 2 2 2 5 5 6 8 2 0 0 0 0 3 4 0 Example 5-3a Make a key and label Describe data by stating the range and where the most data is located Range = 40 - 3 Range = 37 1|0 = 10 years 3 4 6 8 Most of the data is in the 10’s 3/3
Stem Leaf Answer: 1|0 = 10 years 0 3 4 6 8 1 0 0 2 2 2 5 5 6 8 2 0 0 0 0 3 4 0 Example 5-3a Most of the animals had a lifespan of 10-20 years Range = 37 years 3/3
Test Scores 82 94 75 85 88 90 93 80 58 77 86 92 81 85 94 79 86 93 87 93 96 80 82 76 Example 5-2b * TEST SCORESThe table below shows the test scores earned by a class of middle school math students on a chapter test. Make a stem-and-leaf plot of the data. Then use it to describe how the data are spread out. 3/3
Answer: Stem Leaf 7|5 = 75 points 5 8 6 7 5 6 7 9 8 0 0 1 2 2 5 5 6 6 7 9 0 2 3 3 3 4 4 6 Most of the students scored in the 80’s and 90’s Range = 38 and there is an outlier of 58 Example 5-2b 3/3
End of Lesson 5 Assignment