Download
1 / 16
160 likes | 310 Views
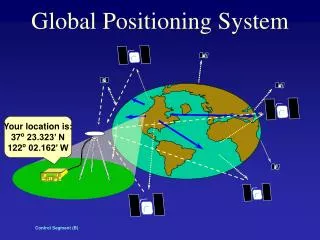
Towards Global Network Positioning. T. S. Eugene Ng and Hui Zhang Department of Computer Science Carnegie Mellon University. MIT. CMU. Stanford. MIT. Berkeley. CMU. Berkeley. Stanford. CMU. MIT. MIT. CMU. Stanford. Stanford. MIT. MIT. Berkeley. Berkeley. CMU. CMU. Stanford.

E N D
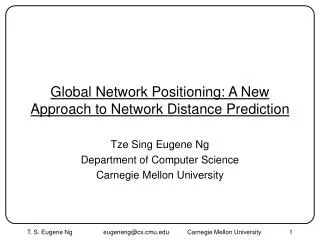
Towards Global Network Positioning T. S. Eugene Ng and Hui Zhang Department of Computer Science Carnegie Mellon University
MIT CMU Stanford MIT Berkeley CMU Berkeley Stanford CMU MIT MIT CMU Stanford Stanford MIT MIT Berkeley Berkeley CMU CMU Stanford Berkeley Berkeley Stanford New Challenges • Large-scale distributed services and applications • Napster, Gnutella, End System Multicast, etc • Large number of configuration choices • K participants O(K2) e2e paths to consider
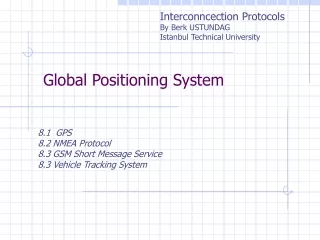
Role of Network Distance Prediction • On-demand network measurement can be highly accurate, but • Not scalable • Slow • Network distance • Round-trip propagation and transmission delay • Relatively stable • Network distance can be predicted accurately without on-demand measurement • Fast and scalable first-order performance optimization • Refine as needed
A/B 50ms HOPS Server Tracer Tracer Tracer State of the Art: IDMaps [Francis et al ‘99] • A network distance prediction service A B
What Can be Improved? • Scalability • Speed • Accuracy
Global Network Positioning (GNP) • Model the Internet as a geometric space (e.g. 3-D Euclidean) • Characterize the position of any end host with coordinates • Use computed distances to predict actual distances • Reduce distances to coordinates (x2,y2,z2) y (x1,y1,z1) x z (x4,y4,z4) (x3,y3,z3)
(x2,y2) y L2 (x1,y1) L1 L1 x L3 L2 L3 (x3,y3) • Small number of distributed hosts called Landmarks measure inter-Landmark distances Landmark Operations • Compute Landmark coordinates by minimizing the overall discrepancy between measured distances and computed distances • Cast as a generic multi-dimensional global minimization problem Internet
(x4,y4) Ordinary Host Operations (x2,y2) y L2 • Each ordinary host measures its distances to the Landmarks, Landmarks just reflect pings (x1,y1) L1 L1 L3 x Internet L2 L3 (x3,y3) • Ordinary host computes its own coordinates relative to the Landmarks by minimizing the overall discrepancy between measured distances and computed distances • Cast as a generic multi-dimensional global minimization problem
GNP Advantages Over IDMaps • High scalability and high speed • End host centric architecture, eliminates server bottleneck • Coordinates reduce O(K2) communication overhead to O(K*D) • Predictions are locally and quickly computable by end hosts • Enable new applications • Structured nature of coordinates can be exploited • Simple deployment • Landmarks are simple, non-intrusive (compatible with firewalls)
Evaluation Methodology • 19 Probes we control • 12 in North America, 5 in East Asia, 2 in Europe • 869 IP addresses called Targets we do not control • Span 44 countries • Probes measure • Inter-Probe distances • Probe-to-Target distances • Each distance is the minimum RTT of 220 pings
T T T T T T Evaluation Methodology (Cont’d) • Choose a subset of well-distributed Probes to be Landmarks, and use the rest for evaluation P2 (x1,y1) P1 P3 (x2, y2) P4
Performance Metric • Relative error • Symmetrically measure over and under predictions
GNP Accuracy 5-Dimensional Euclidean Space Model
GNP vs IDMaps 5-Dimensional Euclidean Space Model
??? Why the Difference? • IDMaps tends to heavily over-predict short distances • Consider (measured 50ms) • 22% of all paths in evaluation • IDMaps on average over-predicts by 150 % • GNP on average over-predicts by 30%
Summary • Network distance prediction is key to performance optimization in large-scale distributed systems • GNP is scalable • End hosts carry out computations • O(K*D) communication overhead due to coordinates • GNP is fast • Distance predictions are fast local computations • GNP is accurate • Discover relative positions of end hosts