Download
1 / 7
70 likes | 187 Views
Evolution of clusters. M. Arnaud CEA - service d’astrophysique Saclay. Assuming favored cosmology W =0.3 L =0.7. The sample. • Clusters from SHARC survey [Romer et al 00; Nichol et al 99; Burke et al 03] • XMM follow up [ Sharc/SSC/SOC/EPIC collaboration] in

E N D
Evolution of clusters M. Arnaud CEA - service d’astrophysique Saclay Assuming favored cosmology W =0.3 L=0.7
The sample • Clusters from SHARC survey [Romer et al 00; Nichol et al 99; Burke et al 03] • XMM follow up [Sharc/SSC/SOC/EPIC collaboration] in - GT time (P.I J. Bartlett) [Lumb et al 03]7 clusters 0.45 < z < 0.62 - OT time (P.I MA) 7(6) clusters 0.3 < z < 0.4 ==> Work in progress from combined set Some Images: RX J0256 z=0.36 kT =5 ±0.5 keV RX J2237 z=0.30 kT =3 ±0.5 keV RX J1120 z=0.6 kT =5.3 ±0.5 keV [Majerowicz et al, A&A, 03] [Arnaud et al, A&A, 02]
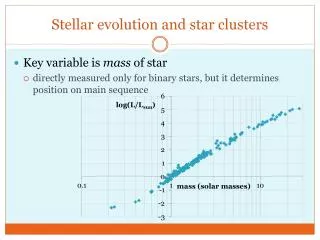
XMM Abell 3158 z=0.06 RXJ 1120 z=0.6 2.6 M pc ROSAT What do we expect ? • ICM: evolving in the gravitational potential of the DM: fgas = cst ; GMV/R a kT • Clusters collapsed at z correspond to a fixed density contrast: GMV/R3 = <rDM> =d rc (z) ; d~200 Evolution with z viarc (z)a h2(z) Scaling laws: Q = A(z)Ta: Mgasa MVa h-1(z) T3/2 Rv a h-1(z) T1/2 LX a h(z) T2 For a given mass: at higher z: clusters are denser, smaller, brighter
For standard DM model: Lxºf2gas(T,z)< n2gas >/<ngas>2h(z) T2 Could indicate evolving: fgas(T)and/orshape The evolution of the Lx -T relation There is evolution ! A bit larger than expected ? in agreement with Chandra [ Vikhlinin et al, 2002] ==> Look at gas density (EM) profiles (normalisation and shape)
Self -similar evolution of the the gas distribution ? Prediction: clusters are denser: rgas arDM arc (z) a h(z)2 and smaller: Rv a h(z)-1 Sx EM = ∫ n2gas dl a h(z)3 ? • Scaled according to standard evolution: EMsc = h(z)-3 T-1.38 EM NB ‘ non standard ’ but cst EM-T slope • Compared to local profile • ~ agreement for individual profiles[ taken into account local dispersion and errors] • ~ Similar shape • BUT systematic discrepancies... Most profiles above local curve [stronger effect for higher z sample] More evolution ? (as for Lx-T) [Arnaud et al, in prep]
RXJ 1120 T =5.3 keV z=0.6 Temperature profile • XMM observation of RXJ 1120 [Arnaud et al A&A, 2002] First (~ precise) measurement of temperature distributionat z=0.6 Flat kT profile up to 0.5 virial radius (as at z~0)
CONCLUSIONS XMM results show: Clusters do form a self-similar population down to kT~ 2keV and up to high kT and z • Self similarity of formbeyond core • Scaling lawswith z (and kT) • First evidence that numerical simulation predict thecorrect shape for the DM distribution up to virial radius Self-similarity differs from purely gravitational model • Normalisation of the M-T relation ==> (universal) ICM structure not correct • Slopes : EM-T : steeper ; S-T shallower: likely due to overall gas content • Possible stronger evolution of ICM scaling laws ==> modelling of the DM collapse probably OK ==> Gas physics still to be better understood Current pre-heating models failure What is needed: • Larger local samples on wide kT range ==> e.g. M-T relation; c(M) ?; dispersion in ICM scaling laws and origin • Larger distant samples ==> e.g. evolution of both normalisation and slopes