Download
1 / 12
120 likes | 218 Views
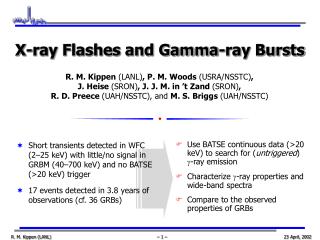
Short transients detected in WFC (2–25 keV) with little/no signal in GRBM (40–700 keV) and no BATSE (>20 keV) trigger 17 events detected in 3.8 years of observations (cf. 36 GRBs). Use BATSE continuous data (>20 keV) to search for ( untriggered ) g -ray emission

E N D
Short transients detected in WFC (2–25 keV) with little/no signal in GRBM (40–700 keV) and no BATSE (>20 keV) trigger 17 events detected in 3.8 years of observations (cf. 36 GRBs) Use BATSE continuous data (>20 keV) to search for (untriggered) g-ray emission Characterize g-ray properties and wide-band spectra Compare to the observed properties of GRBs X-ray Flashes and Gamma-ray Bursts R. M. Kippen (LANL), P. M. Woods (USRA/NSSTC), J. Heise (SRON), J. J. M. in ’t Zand (SRON), R. D. Preece (UAH/NSSTC), and M. S. Briggs (UAH/NSSTC)
10 unocculted events observed with BATSE 9 events detected (<300 keV) by combining detectors ~Isotropic sky Dist. Qualitatively similar to weak GRBs Search for -ray Emission
Standard Burst Parameters • Apply Std. BATSE burst analysis to flashes • Compare to BATSE GRB catalog (1973 bursts w/flux, flu, dur) • Flashes consistent with weak, long-duration GRBs • How do detailed spectra compare?
Time averaged flash spectra Good agreement between WFC & BATSE around 20 keV 8 events have significant curvature (compared to single power law fit) Epeak and a are well constrained Band/Comp models generally consistent WFC/BATSE Joint Spectral Analysis
Compare to Preece et al. results for 156 bright GRB (BATSE-only) Also compare 18 WFC-selected GRBs (BATSE-only spectra) WFC-selected GRBs consistent with bright GRBs Flashes have consistent a & b Epeak significantly different (lower) PK-S ~ 0.1 PK-S ~ 10-8 PK-S ~ 0.2 Large Uncertainties! Flashes vs. Bright GRBs
Compare “Comptonized” joint fit results to Mallozzi et al. [2000] BATSE GRB spectral catalog (1023 bursts) a consistent with long GRBs Epeakroughly follows hardness intensity trend of long GRBs Flashes vs. Dim GRBs
Flashes vs. Dimmest GRBs • Compare to BATSE 5B catalog Briggs et al. [2002] (2704 triggers) • Characterize spectra with broad-band hardness ratios • Flashes similar in hardness to bursts of same intensity • Compare to Stern et al. [2000] catalog (3923 off-line triggers) • ~400 bursts per year (full-sky) with similar hardness, duration, and intensity = 40% of all long bursts • Consistent with WFC detection rate of FXTs = 32% of all SAX bursts
X-ray flashes similar to GRBs except that they emit most power in X-rays Joint WFC+BATSE spectral fits reveal that flashes have significantly curved spectra — similar to GRBs Spectra of X-ray flashes are roughly consistent with the long GRB Epeak vs. intensity trend Could represent a large extension of the full GRB population Caveats: Small sample size Subject to selection and analysis biases Future: Afterglow counterparts (so far elusive) will conclusively show how flashes are related to GRB BeppoSAX & HETE continue to routinely observe flashes, but lack sensitive -ray data Swift (5–150 keV) should provide a large sample for wide-band spectral comparisons Conclusions
BATSE Search Results (20–300 keV) • 10 unocculted events with BATSE continuous data • 9 detections (> 5 sigma in select, summed detectors) • No detections above 300 keV