Download
1 / 13
190 likes | 760 Views
Analysis of Microbial Community Structure. Historical Perspective on Microbial Diversity Assessing Diversity Alone Diversity With Phylogeny Diversity of Function. Historical Perspective on Microbial Diversity. Knowledge is limited by our tools.

E N D
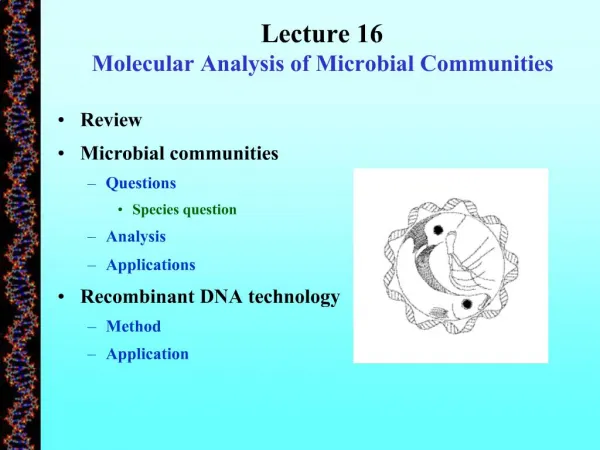
Analysis of Microbial Community Structure Historical Perspective on Microbial Diversity Assessing Diversity Alone Diversity With Phylogeny Diversity of Function
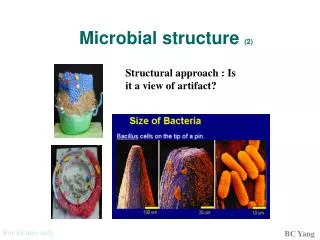
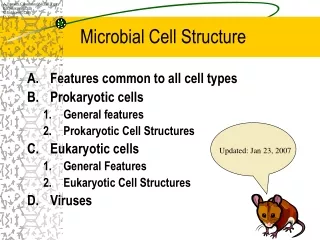
Historical Perspective on Microbial Diversity • Knowledge is limited by our tools. • Cultivation missed about 99.9% of no. estimates. • Both biomass and diversity underestimated. • Molecular techniques and phylogeny: • Independent of cultivation • Unknowns can be grouped with knowns
Study Diversity Independent of Cultivation • Extract DNA from sample (or not?) • PCR Amplification of 16SrDNA • Clone all amplicons • Screen clones for differences (e.g. ARDRA). • Document richness and evenness of clones. • Preliminary phylogeny • Sequence clones of interest. • Perform complete phylogenetic analysis; & identify known or prior documented unknown strains.
Ligate PCR amplicon into a cloning plasmid; transform host bacterium; isolate recombinant plasmids for sequencing of inserted 16SrDNA.
Screen Clones • ARDRA is an RFLP on the 16SrDNA amplified by PCR • RFLP = restriction fragment length polymorphism • ARDRA has been used: • - post-cloning • pre-cloning • isolates or communities • For screening clones with 16SrDNA, enzymes that separate plasmid DNA are used for clearer results.
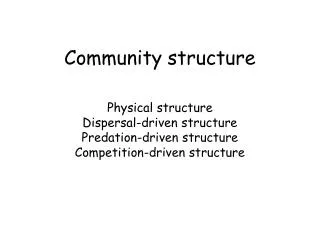
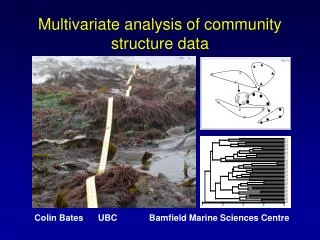
Preliminary Phylogenetic Analysis • Fingerprints (banding patterns) can be converted to analog data based on presence or absence of bands of different sizes. • Pairwise comparison of all clone fingerprints will yield a similarity (distance) matrix. • Phylogenic tree can be computed from a cluster analysis of the matrix.
Complete Analysis 16SDNA Sequencing: 1) Dideoxynucleotides stop synthesis at different sites; different size fragments made for each sequence position. 2) Each ddNTP has a fluorescent label for easy specific detection as it’s separated by HPLC or electrophoresis.
Quick Assessment of Diversity“One band = One bug” (?)(little phylogeny information) • RISA (ribosomal intergenic spacer analysis) • Often get overlapping bands (on band = > 1 bug) • Phylogenetic information limited by 16SrDNA overlap • ARDRA (amplified ribosomal DNA restriction analysis) • Good for identification of isolates; esp. with multiple restriction enzymes. • Too many bands makes it hard to interpret mixed populations. • T-RFLP (terminal restriction fragment polymorphism) • Steps like ARDRA, but terminal 3’ end of gene is fluorescent • Multiple restriction enz. Give best results; maybe used to query RDP.
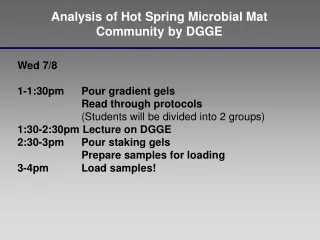
DGGE • Denaturing Gradient Gel Electrophoresis • Separated DNA of same size based on sequence differences. • Different sequences “behave differently at different amounts of denaturing chemical (or heat; see TGGE) • At some point 16SrRNA DNA strands completely separates. • Complete separation of PCR amplicon is hindered by GC-clamp added to one of the PCR primers.
Gradient Parallel for Analysis • Conditions change mostly due to size of amplicon. • May be applied at different taxa (groups) • Bands may be cut out and DNA cloned for phylogenetic analysis. • Larger bands more information.
Diversity Metrics: • Shannon-Weaver • Simpson