1 / 1

Additional File 8 . Area-proportional Venn diagrams comparing clone overlap among biological replicates at given time points across K562 experiments.

iain
Download Presentation

An Image/Link below is provided (as is) to download presentation Download Policy: Content on the Website is provided to you AS IS for your information and personal use and may not be sold / licensed / shared on other websites without getting consent from its author. Content is provided to you AS IS for your information and personal use only. Download presentation by click this link. While downloading, if for some reason you are not able to download a presentation, the publisher may have deleted the file from their server. During download, if you can't get a presentation, the file might be deleted by the publisher.

E N D

Presentation Transcript


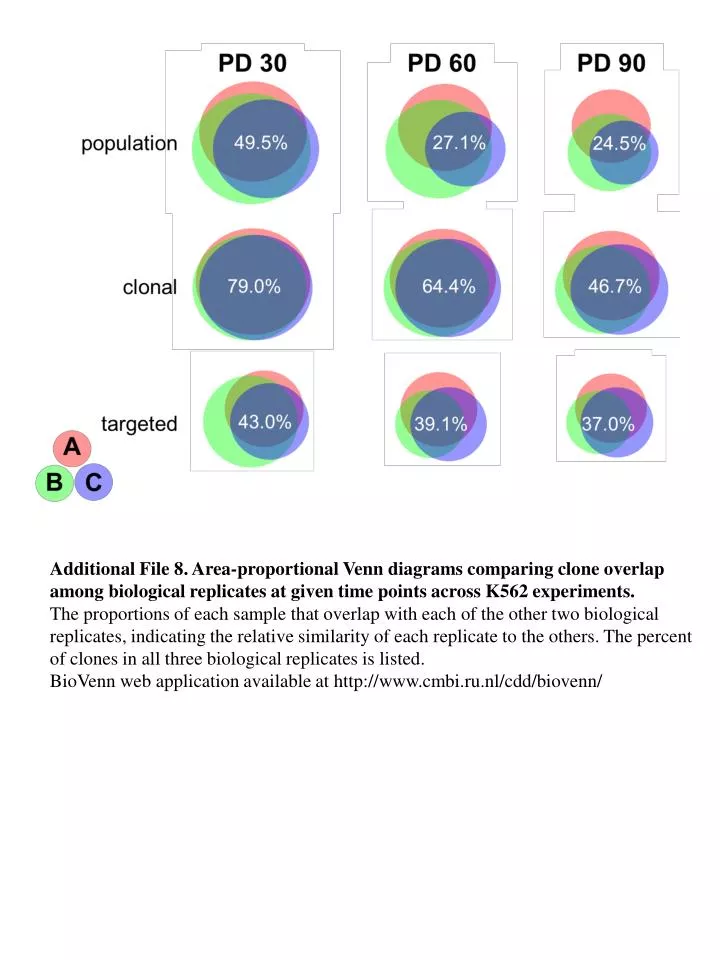
  1. Additional File 8. Area-proportional Venn diagrams comparing clone overlap among biological replicates at given time points across K562 experiments. The proportions of each sample that overlap with each of the other two biological replicates, indicating the relative similarity of each replicate to the others. The percent of clones in all three biological replicates is listed. BioVenn web application available at http://www.cmbi.ru.nl/cdd/biovenn/

More Related