Download
1 / 17
170 likes | 286 Views
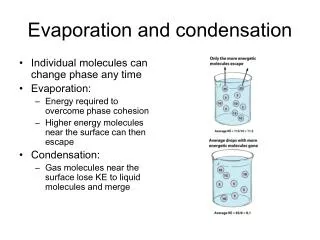
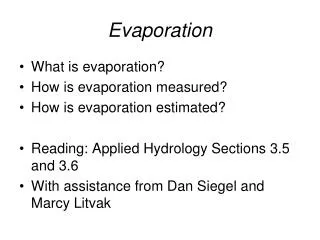
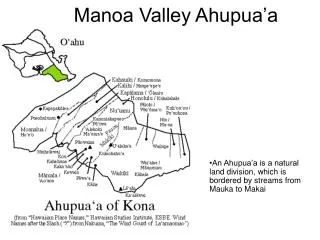
Potential Evaporation and Irrigation in Manoa Valley. Geography 405 Liat Portner, George Bugarin , Alexa Grinpas,Henry Pascher , Nicole Miller, Maeghan Castillo, Joshua Silva, Elise Kama, Keiichiro Yoshida. Purpose. Main Objective: Evaluate the water balance of Manoa Valley

E N D
Potential Evaporationand Irrigation in Manoa Valley Geography 405 Liat Portner, George Bugarin, AlexaGrinpas,HenryPascher, Nicole Miller, Maeghan Castillo, Joshua Silva, Elise Kama, Keiichiro Yoshida
Purpose • Main Objective: Evaluate the water balance of Manoa Valley Our Objective: Estimate the Potential Evaporation and Irrigation for Manoa Valley
PE Modeling Methods • Net Radiation, (Air) Temperature, Wind speed and Relative Humidity measured at the 2 weather stations were used to calculate PE • Interpolated to Grid cells using inverse distance weighting and the Normal Ratio Method • Distance from each grid to each weather station • Mean PE at each grid and both weather stations PE_i=[1/d_l*(PE_l*(N_i/N_l))]+[1/d_m *(PE_m*(N_i/N_m))] 1/d_l +1/d_m
Irrigation Sampling Methods • Based on four main residential streets, spanning entire length of Manoa Valley • Rate, Frequency, Area, Grid Location
Irrigation Modeling • Interpolating to grid: • y = mean daily irrigation • x = mean daily (PE-RF) • Assumptions: • Days with no rainfall- days with irrigation (and the reverse) • All irrigation occurring at 6:00 PM
PE Results (1) • PE peaks during midday • Low PE during night • Driven by Radiation • Cloud Cover
Irrigation Results (1) Peak mean PE correlates with IRR events
Discussion (1) • Inverse relationship between PE and RF • Grids 6,12 and 19 can be accounted for by orientation of valley
Discussion (2) • Direct relationship between PE and IRR • Note: Irrigation not actually occurring in every grid cell
Potential Evaporation Errors • Weather stations • Interpolating from only two sources • Topography • Crude assignment of mean values
Irrigation Errors • Measuring Irrigation • Imprecise measuring tools • Sample size and randomization • Interpolation Assumption • Everyone irrigating when no rain • Everyone irrigating at 6:00 PM • Irrigation occurring in all grids
Conclusion • PE and IRR lower at back of valley, higher at front • Rainfall decreases as PE increases • Irrigation increases as PE increases • Irrigation increases as rainfall decreases • Making up for increasing demands of water • Less water available because less water and land cover