Download
1 / 7
70 likes | 227 Views
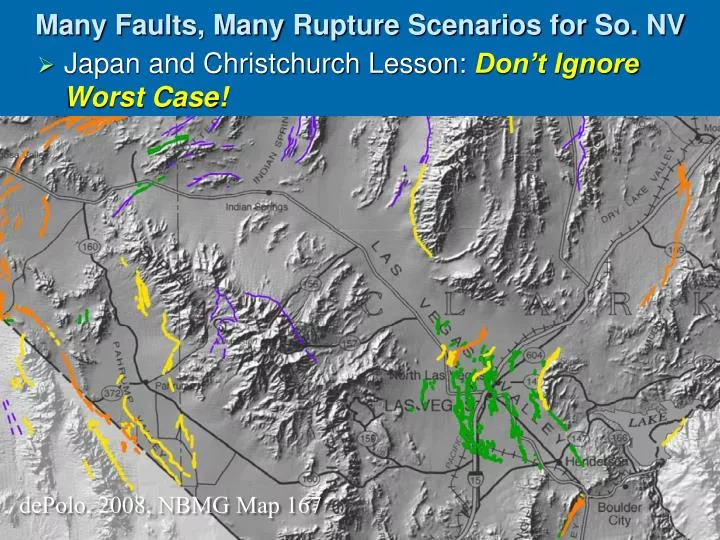
Many Faults, Many Rupture Scenarios for So. NV. dePolo, 2008, NBMG Map 167. Japan and Christchurch Lesson: Don’t Ignore Worst Case!. Frenchman Mtn. Fault M6.7 ShakeZoning. NSZ Peak Horiz . Ground Velocity Map. NSZ Shaking Animation at 0.5 Hz.

E N D
Many Faults, Many Rupture Scenarios for So. NV dePolo, 2008, NBMG Map 167 • Japan and Christchurch Lesson: Don’t Ignore Worst Case!
Frenchman Mtn. Fault M6.7 ShakeZoning NSZ Peak Horiz. Ground Velocity Map NSZ Shaking Animation at 0.5 Hz
Effect of Parcel Map Over IBC Defaults- FMF M6.7 1D: IBC and ShakeMap 3D: ShakeZoning
Pushing the Predictions Through HAZUS ShakeZoning ShakeMap • $8.6 Billion Loss • 287-610 Casualties • $4.8 Billion Loss • 22-58 Casualties
Combine the Scenarios Probabilistically λ = annual frequency of exceeding ground motion u0 rate(M, sourcej) = annual rate of occurrence for an earthquake with magnitude Mat source locationj P= probability of ground motions u ≥ u0 at sitei, if an earthquake occurs at source locationjwith magnitude M After Frankel et al., USGS OFR 2007–1175
With Many Scenarios, Define Probabilistic Hazard • Recurrence Intervals: • Black Hills- 15 ka • Frenchman Mtn.- 45 ka • e.g., PGV at UNLV: • ~20 cm/s from BHF • ~15 cm/s from FMF • Combine rates per annum: • >15 cm/s at 0.0001 p.a. • >20 cm/s at 0.00007 p.a.
Conclusions • Basin trapping leads to worst-case shaking. • 10,721 Parcel Map measurements completed in 3 years for IBC compliance in Clark County. • NSZ validated at 0.1-Hz for Las Vegas region with 1992 LSM recordings. • The Parcel Map has surprisingly large effects on ground motions predicted from physics. • Nevada ShakeZoning predicts twice the damage and five times the casualties as ShakeMap, for the Las Vegas worst case.