Download
1 / 13
130 likes | 221 Views
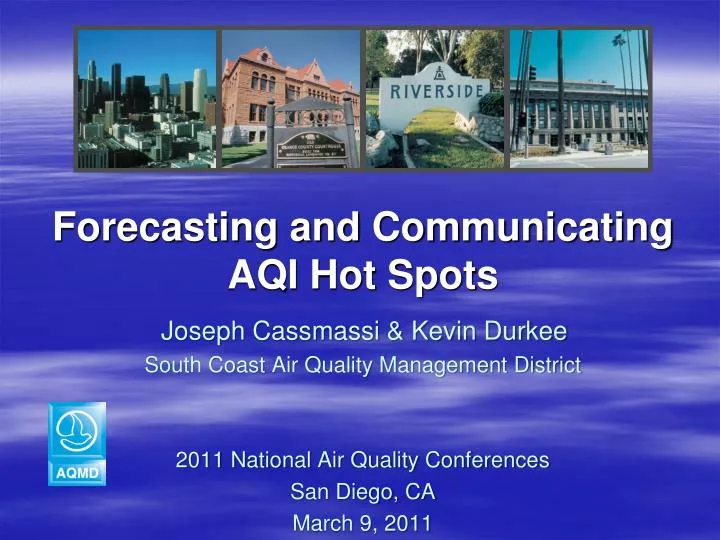
Forecasting and Communicating AQI Hot Spots Joseph Cassmassi & Kevin Durkee South Coast Air Quality Management District 2011 National Air Quality Conferences San Diego, CA March 9, 2011. South Coast Air Quality Management District. South Coast Air Basin: 10,743 square miles

E N D
Forecasting and Communicating AQI Hot Spots Joseph Cassmassi & Kevin Durkee South Coast Air Quality Management District 2011 National Air Quality Conferences San Diego, CA March 9, 2011
South Coast Air Quality Management District South Coast Air Basin: • 10,743 square miles • 16 million people • 11 million gasoline vehicles • 300,000 diesel vehicles MDAB SoCAB MDAB SSAB
SCAQMD Programs that Provide Some Insight into AQI Hot Spot Forecasting • Routine Multi-Area AQI Forecasts • 45 Source-Receptor Areas • Daily O3, CO, NO2, PM10, PM2.5 • Coachella Valley windblown dust forecasts & advisories • Prescribed and agricultural burn forecasts • Residential wood burning forecasts • Emergency response forecasts and advisories • e.g., wildfires and hazardous release support • Field Study Forecasting • Support of special monitoring studies and field campaigns
Primary Air Quality Impact Areas O3 O3 PM2.5, NO2 PM10, PM2.5 CO
SCAQMD Air Quality Forecast Map AQMD Website: http://www.aqmd.gov
Interactive Air Quality Monitoring Map • Incorporates real-time data from stations and mobile monitors • Proxy method to extrapolate levels in unmonitored areas • Color-coded to Air Quality Index
Some Recent Near-Source Monitoring Experience • Port Studies • Community-based monitoring near Ports of Los Angeles & Long Beach • Alameda Corridor Study • Near-road monitoring of goods movement route from ports • CO, NOx, PM, Black Carbon, … • MATES III • Multiple Air Toxics Exposure Study • Lead Monitoring • Source-Specific TSP Lead • Airport Studies • Large airports (LAX Study) • General aviation (Van Nuys, Santa Monica, Long Beach) • Wildfire response monitoring • eBAM PM2.5 portable monitors
Thoughts on Forecasting & Communicating AQI for Hot Spots • Develop Tools • Reliable real-time monitoring is critical, including meteorology • Need visualization tools for measurement data • Automate routine tasks where possible to give forecasters time to analyze data • Use models to provide forecast guidance • Need historical data for development • Develop Forecaster Confidence • Know your Target Audience • Avoid Conflicting Messages • Have a consistent messaging system for both ambient and near-source forecasts and alerts • News media, email/EnviroFlash, web, phone aps, IVR/phone messaging, … • Keep messages simple • Don’t expect detailed news coverage every day • Don’t Cry Wolf
Some Issues • Near-source monitors won’t always be in the right location • Changing meteorological conditions • Effects of buildings, sound walls, roadway turbulence • Chemical reactions cause changes with distance • How do we communicate AQI near sources? • Measurements will vary considerably by time of day, day of week, traffic pattern, wind flows, stability, … • Messaging may be complicated • May need to focus AQI messaging on the population with the worst impact • Research may need to focus on health impacts of shorter activity-based exposure times “Tomorrow’s air quality in your area is predicted to be in the Moderate range, but rush hour commuters and residences who will be on or near major roadways for over one hour will experience Unhealthy air quality.”