Download
1 / 42
420 likes | 547 Views
Exam #3 W 12/5 at 7-8:30pm in ETC 2.108 for the 9am class and ECJ 1.202 for the noon class Review T 12/4 at 5pm in WRW 102 Homework #4 due 12/3 (if needed) Bonus #2 is posted. Grades: A = 88.5+ B = 77.5 C = 65.5 Exam avg x 0.88 + homework + bonus = grade.

E N D
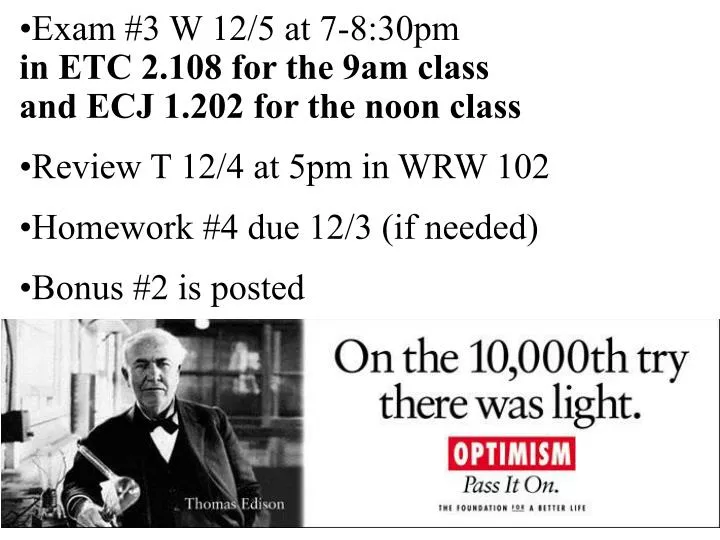
Exam #3 W 12/5 at 7-8:30pmin ETC 2.108 for the 9am class and ECJ 1.202 for the noon class • Review T 12/4 at 5pm in WRW 102 • Homework #4 due 12/3 (if needed) • Bonus #2 is posted
Grades: A = 88.5+ B = 77.5 C = 65.5 Exam avg x 0.88 + homework + bonus = grade
Tracking two separate genes, for two separate traits, each with two alleles. Ratio of 9:3:3:1 Fig 3.4
Box 2.2 Crossing-over Meiosis: In humans, crossing-over and independent assortment lead to over 1 trillion possible unique gametes. (1,000,000,000,000) Meiosis I (Ind. Assort.) Meiosis II 4 Haploid cells, each unique
Homologous pair of chromosomes
Longer regions have more crossovers and thus higher recombinant frequencies Fig 4.10
=25% 42% 41% 9% 8%
By comparing recombination frequencies, a linkage map can be constructed = 17 m.u.
42 recombinants out of 381 offspring = 42/381 11% recombination
The probability of crossing over can be used to determine the spatial relationship of different genes Fig 4.9
Double recombinants arise from two crossovers Recombinant Fig 4.11
What is the relationship between these 3 genes? What order and how far apart? similar to pg 141
What is the relationship between these 3 genes?What order and how far apart? similar to pg 141
Double crossover similar to pg 141
We have the order.What is the distance? similar to pg 141
Recombinants between st and ss: (50+52+5+3)/755=14.6% similar to pg 141
Recombinants between ss and e: (43+41+5+3)/755=12.2% similar to pg 141
Put it all together… 26.8 m.u. st ss e 14.6 m.u. 12.2 m.u.
Recombination is not completely random. physical distance linkagemap Yeast chromosome 3 Fig 4.13 and 20
Genotype Phenotype Genes code for proteins (or RNA). These gene products give rise to traits… It is rarely this simple. Figs 1.15-17
The relationship between genes and traits is often complex Complexities include: • Complex relationships between alleles • Multiple genes controlling one trait • One gene controlling multiple traits • Environmental effects
The colors of peppers are determined by the interaction of several genes
Complexity of inheritance leads to genetic diversity. Fig 3.14+.16
Seven alleles and their interactions in leaf patterning of clover Fig 6.7
The relationship between genes and traits is often complex Complexities include: • Complex relationships between alleles • Multiple genes controlling one trait • One gene controlling multiple traits • Environmental effects
1 gene controlling many traits
S=sickle-cell H=normal Sickle-Cell Anemia Mom = HS Dad = HS Dad H or S possible offspring 75% Normal 25% Sickle-cell HS HH H or S Mom HS SS
S=sickle-cell H=normal Sickle-Cell Anemia Mom = HS Dad = HS possible offspring Oxygen transport: 75% Normal 25% Sickle-cell Malaria resistance: 75% resistant 25% susceptible Dad H or S HS HH H or S Mom HS SS
The relationship between genes and traits is often complex Complexities include: • Complex relationships between alleles • Multiple genes controlling one trait • One gene controlling multiple traits • Environmental effects
Next we will look at what DNA can tell us about the origins of Homo sapiens.
Exam #3 W 12/5 at 7-8:30pmin ETC 2.108 for the 9am class and ECJ 1.202 for the noon class • Review T 12/4 at 5pm in WRW 102 • Homework #4 due 12/3 (if needed) • Bonus #2 is posted