Download
1 / 69
720 likes | 751 Views
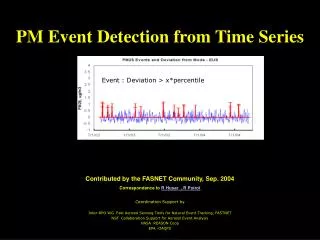
Ch 04 Event Detection. Epoch in biomedical signal. Physiological events. QRS complex. 0.1 mV. P R segment. 0.04 ms. Q. S T interval. S. P R interval. Q T interval. R. S T segment. T. P. U. 4.2.1 ECG. 4.2.2 PCG. 4.2.3 Dicrotic notch. Carotid pulse

E N D
Epoch in biomedical signal Physiological events
QRS complex 0.1 mV PR segment 0.04 ms Q ST interval S PR interval QT interval R ST segment T P U 4.2.1 ECG
4.2.3 Dicrotic notch Carotid pulse ** a pressure signal ** recorded over the carotid artery ** indicates the variations in arterial blood pressure and volume with each heart beat ** resembles the morphology of the pressure signal at the root of the aorta ** cannot be used to measure absolute pressure ** can assist in identifying S2 and its components
Fig. 1-24 P (pressure wave) blood ejection from LV T (tidal wave) a reflected pulse returning from the upper body D (dicrotic notch) closure of the aortic valve DW (dicrotic wave) a reflected pulse from the lower body
4.2.4 EEG • The K-complex • (b) The lambda wave • (c ) the mu rhythm • (d) a spike • (e) sharp waves • (f) spike-and-wave complexes • (g) A sleep spindle • (h) Vertex sharp waves (V) • (i) Polyspike discharges
4.3.1 Derivative-based methods for QRS detection Solution 1: Q: Why not search ECG for the QRS peak directly? A: QRS complex may not be the highest wave.
1 0.5 ECG, resample 0 -0.5 -1 0 0.1 0.2 0.3 0.4 0.5 0.6 0.7 1 0.8 0.6 y0 0.4 0.2 0 0 0.1 0.2 0.3 0.4 0.5 0.6 0.7
n-8 n-7 n-6 n-5 n-4 n-3 n-2 n-1 n
Matched filter 4.4.2 Template matching for EEG spike-and wave detection
4.6 The Matched Filter Usefulness: to detect signals of known characteristics that are buried in noise Operation: a correlation between the input signal and the template