Download
1 / 41
440 likes | 667 Views
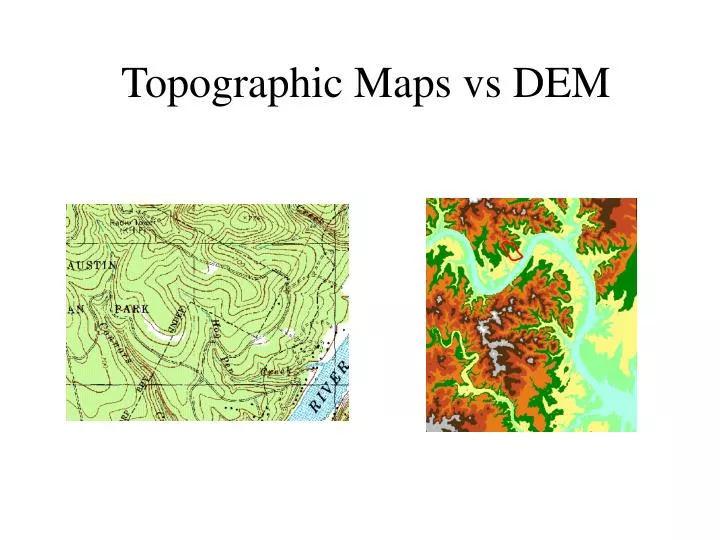
Topographic Maps vs DEM. Topographic Map 1:24,000 Scale http://www.tnrcc.state.tx.us/gis/raster.html. 20 ft contour. 100 ft contour. Stream Center Line. Flow in Direction of Steepest Descent. Watershed Delineation by Hand Digitizing. Watershed divide. Outlet. Drainage direction.

E N D
Topographic Map1:24,000 Scalehttp://www.tnrcc.state.tx.us/gis/raster.html 20 ft contour 100 ft contour Stream Center Line
Watershed Delineation by Hand Digitizing Watershed divide Outlet Drainage direction
DEM Elevations 720 720 Contours 740 720 700 680 740 720 700 680
DEM Elevations Contours 700 680
67 56 49 46 50 53 44 37 38 48 58 55 22 31 24 61 47 21 16 19 53 34 12 11 12 Digital Elevation Model
67 56 49 46 50 53 44 37 38 48 58 55 22 31 24 61 47 21 16 19 53 34 12 11 12 Cell Definition 30 m cell 50 (cell value) cell
Filling in the Pits • DEM creation results in artificial pits in the landscape • A pit is a set of one or more cells which has no downstream cells around it • Unless these pits are filled they become sinks and isolate portions of the watershed • Pit filling is first thing done with a DEM
“Burning In” the Streams - Improve accuracy based on photograph Take a mapped stream network and a DEM Make a grid of the streams Raise the off-stream DEM cells by an arbitrary elevation increment Produces "burned in" DEM streams = mapped streams = +
32 64 128 16 1 8 4 2 Eight Direction Pour Point Model
67 56 49 53 44 37 58 55 22 Direction of Steepest Descent 1 1 67 56 49 53 44 37 58 55 22 Slope:
2 2 4 4 8 1 2 4 8 4 128 1 2 4 8 2 1 4 4 4 1 1 1 2 16 Flow Direction Grid
32 64 128 16 1 8 4 2 Flow Direction Grid- Red is NE
Flow Accumulation Grid 0 0 0 0 0 3 2 0 0 2 0 0 1 0 11 0 0 1 0 15 2 5 0 1 24 Count the # of contributing cells Grid Network
Flow Accumulation Grid 0 0 0 0 0 0 3 2 2 0 0 1 0 0 11 0 0 0 1 15 1 0 2 5 24
0 0 0 0 0 0 3 2 2 0 0 1 0 0 11 0 0 0 1 15 1 0 2 5 24 Flow Accumulation > 5 Cell Threshold
Stream Network for 5 cell Threshold Drainage Area 0 0 0 0 0 3 2 0 0 2 0 0 1 0 11 0 0 1 0 15 2 5 0 1 24
Streams with 200 cell Threshold(>18 hectares or 13.5 acres drainage area)
1000 Cell Threshold Exceeded at Stream Junction 510 989 1504 (>1000)
0 0 0 0 0 3 2 0 0 2 0 0 1 0 11 0 0 1 0 15 2 5 0 1 24 Stream Segments
1 1 2 1 2 3 5 3 3 5 4 4 4 4 4 6 6 6 Stream Segments in a Cell Network 5 5
Watershed andDrainage PathsDelineated from 30m DEM Automated method is more consistent than hand delineation
Subwatersheds for Stream Segments Same Cell Value
Vectorized Streams Linked Using Grid Code to Cell Equivalents Vector Streams Grid Streams


