Download
1 / 15
150 likes | 319 Views
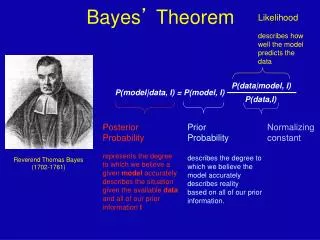
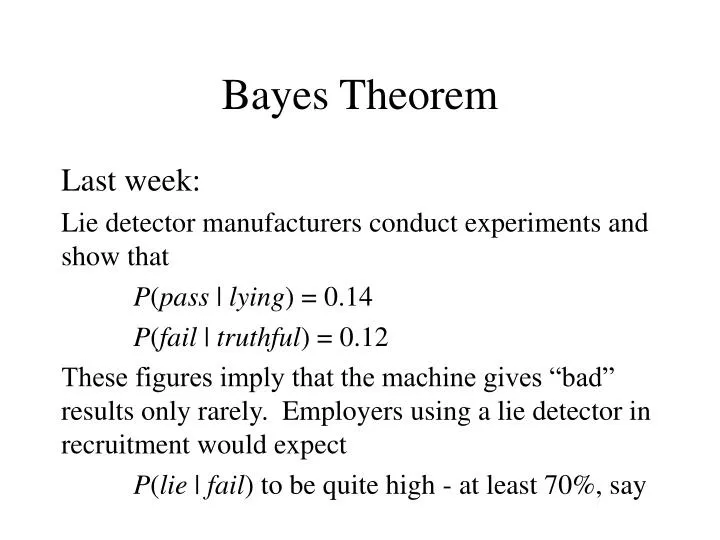
Bayes Theorem. Last week: Lie detector manufacturers conduct experiments and show that P ( pass | lying ) = 0.14 P ( fail | truthful ) = 0.12 These figures imply that the machine gives “bad” results only rarely. Employers using a lie detector in recruitment would expect

E N D
Bayes Theorem Last week: Lie detector manufacturers conduct experiments and show that P(pass | lying) = 0.14 P(fail | truthful) = 0.12 These figures imply that the machine gives “bad” results only rarely. Employers using a lie detector in recruitment would expect P(lie | fail) to be quite high - at least 70%, say
Lie detectors Recall the equation (both sides are equal to P(A and B)) Substitute A = lie, B = fail
Lie detectors To work out P(lie | fail), evaluate the right-hand side of P(fail | lie) = 1 - P(pass | lie) = 1 - 0.14 = 0.86 P(lie) = ?? make a guess at 5% liars ?? 0.05
0.007 0.843 0.836 0.043 0.157 0.114 truth lie 0.05 0.95 pass fail 1 Lie detectors The proportion we expected to be about 70% is more like 27%. These calculations could be done using a table:
Tests for diagnosis Given an illness, scientists could come up with a test which gave a positive or negative outcome. In development, the tests are given to people who are known to be ill and people who are known to be healthy. The tests should show that most ill people get a +ve result and few healthy people get a +ve result. P(+ve | ill) = high P(+ve | healthy) = low (so P(-ve | healthy) = high because these add to 1)
Tests for diagnosis P(+ve | healthy) = pP(-ve | healthy) = 1-p P(+ve | ill) = qP(-ve | ill) = 1-q In practice, the test is administered to people, and if there is a positive result, it is assumed that the patient is likely to be ill. What is P(ill | +ve)?
Tests for diagnosis As in the lie-detector case, we need information about the world context - how rare is this illness? If P(ill) = s then
0.0147 0.00995 healthy ill 0.00475 0.9853 0.98505 +ve 0.005 0.995 0.00025 -ve 1 Tests for diagnosis If s = 0.005 (rare) , p = 0.01 (few healthy people get +ve ) and q = 0.95 (most ill people get +ve) then P(ill | +ve) = 0.33… So a majority of people getting +ve results are healthy.
Forensic evidence Q: If forensic scientists can show that P(forensic tests match | same person) is high and P(forensic tests differ | different person) is high then how should courts interpret forensic evidence? Ans: with care - see a real debate on Bayes and the law at http://www.mcs.vuw.ac.nz/~vignaux/evidence/E96.017_Adams/Adams_NLJ.html
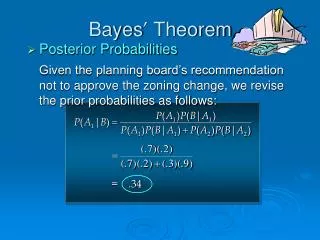
Bayes Theorem - two outcomes Given P(fail | lie) and P(fail | truth), we can work out P(lie | fail) and P(truth | fail)
Bayes Theorem - three outcomes Split candidates into liars, truthtellers and “dissemblers” - people who deliberately withhold information to mislead… Given P(fail | lie), P(fail | diss) and P(fail | truth) calculate P(lie | fail), P(diss | fail) and P(truth | fail)
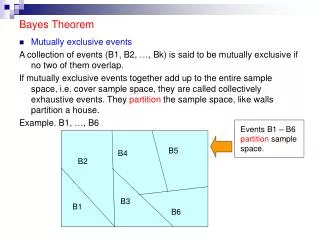
Bayes Theorem - three outcomes It is still possible to use a table to analyse the probabilities given three outcomes: rows sum diss truth lie pass fail 1
Bayes Theorem - three outcomes It is still possible to use a table to analyse the probabilities given three outcomes: diss truth lie pass fail 1 columns sum
Bayes Theorem - many outcomes It is still possible to use a table to analyse the probabilities given many outcomes: A2 A3 A4 A1 rows and columns sum B1 B2 B3 1 P(A3 and B2)
Bayes Theorem - many outcomes It is still possible to use a table to analyse the probabilities given many outcomes: A2 A3 A4 A1 rows and columns sum B1 B2 B3 1 the ratio here is P(B1 | A2)