Download
1 / 18
180 likes | 258 Views
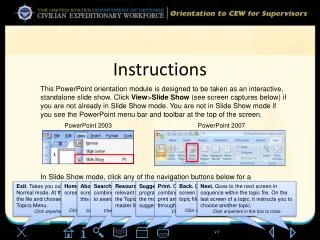
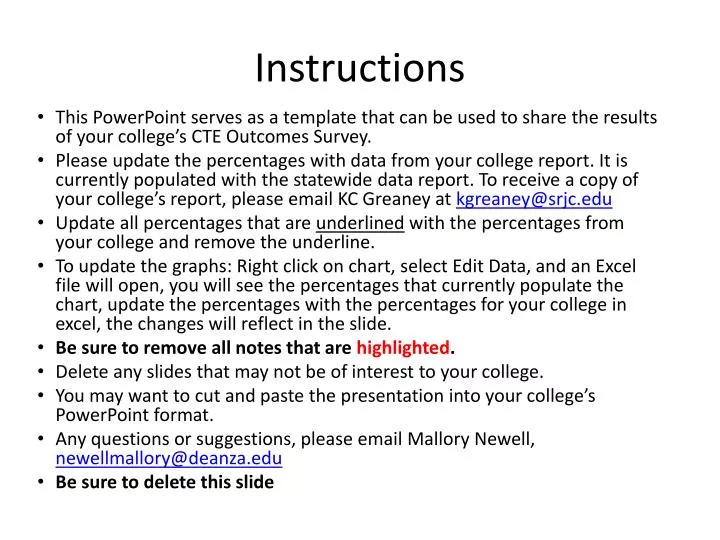
Instructions. This PowerPoint serves as a template that can be used to share the results of your college’s CTE Outcomes Survey.

E N D
Instructions • This PowerPoint serves as a template that can be used to share the results of your college’s CTE Outcomes Survey. • Please update the percentages with data from your college report. It is currently populated with the statewide data report. To receive a copy of your college’s report, please email KC Greaney at kgreaney@srjc.edu • Update all percentages that are underlined with the percentages from your college and remove the underline. • To update the graphs: Right click on chart, select Edit Data, and an Excel file will open, you will see the percentages that currently populate the chart, update the percentages with the percentages for your college in excel, the changes will reflect in the slide. • Be sure to remove all notes that are highlighted. • Delete any slides that may not be of interest to your college. • You may want to cut and paste the presentation into your college’s PowerPoint format. • Any questions or suggestions, please email Mallory Newell, newellmallory@deanza.edu • Be sure to delete this slide
Career and Technical Education (CTE) Employment Outcomes Survey - 2013<College Name> Your NameDate
CTE Programs • Accounting • Administration of Justice • Auto Technology • Business Administration • Child Development • Computer-Aided Design • Environmental Studies • Film/TV Production • Graphic and Interactive Design • Health Technologies • Management • Marketing • Medical Lab Technology • Nursing • Paralegal Studies • Technical Writing • Real Estate Note: Update list with CTE programs at your college and highlight those programs that participated in the survey, to familiarize your audience to your programs.
Background Purpose: To provide information on employment outcomes for students who have participated in career technical education (CTE) programs at California community colleges. Research Questions: • Do students become employed within their field of study? • Does community college coursework positively affected their earning potential? • Why do students drop out of CTE programs? Survey Development: The RP Group partnered with the Bay Area Community College Consortium and practitioners from around the state to develop a universally available survey methodology. The survey is based on completer and leaver surveys that have been conducted at several colleges and was tested through a pilot study.
CTE Employment Outcomes Survey Methodology • Surveys sent to skills-building students if they met one or more of the following criteria in 2010-2011: • Did not enroll in 2011-2012 • Earned a certificate of 6 or more units • Earned a vocational degree • Earned 9+ CTE units
CTE Employment Outcomes Survey Methodology • Surveys were administered in early 2013 by e-mail, then US mail, then telephone. (update with methods the survey was administered at your college) • Our total sample = • Our college’s response rate =
Overall Findings – All Colleges • Completing CTE studies and training – with or without a credential – has positive employment outcomes. • The majority of respondents are employed, working in the same field as their studies, and working full-time. • Respondents saw an increase in their hourly wage after completing their studies. • The majority were satisfied with the education and training they received.
Overall Findings – College Name • Add overall findings from your college reporthere.
College Name Findings • 67% of respondents stated their primary reason for attending college was to earn a certificate or degree (with or without transfer) (Note: Right click on graph, edit data, Excel file will open, make changes to percents in Excel.
College Name Findings • Respondents who did not receive a degree/certificate reported why they stopped taking classes: • Completed their program (N = ) • Got a job (N = ) • Transferred to another school (N = ) • Met their goals (N = ) • Didn’t have enough time for classes (N = ) • Stated the classes they needed were not available (N = ) • Stated family or personal reasons (N = ) (Note: Order in descending order.)
College Name Findings • 92% of respondents were Satisfied or Very Satisfied with the education and training they received at our college • 35% indicated they transferred to a 4-year institution to pursue a bachelor’s degree • 75% of respondents are employed for pay
College Name Findings Respondents reported their current employment status to be: (Note: Right click on graph, edit data, Excel file will open, make changes to percents in Excel.
College Name Findings • Currently employed respondents reported how closely related their current job is to their field of study: • 20% reported very close – My current job is in the same field as my coursework/training • 20% reported close – I use what I learned in my coursework and training even though I am not working in the exact field • 20%reported not close – My studies and training are not at all related to my current job (Note: Order in descending order.)
College Name Findings Respondents reported their work status before and after studies/training (Note: Right click on graph, edit data, Excel file will open, make changes to percents in Excel.
College Name Findings • The hourly wage of degree/certificate earners increasedfrom $17.78 before their studies to ($24.79) after completing a degree or certificate (Note: Right click on graph, edit data, Excel file will open, make changes to percents in Excel.
Findings • Respondents reported the impact of their coursework on their employment: • It enabled them to learn a skill to stay in their job (N = ) • Enabled them to learn skills to get a promotion (N = ) • Enabled them to start their own business (N = ) • Enabled them to learn skills to get a job at a new organization (N = ) • Prepared them for a possible new job (N = ) • Had no impact on their employment (N = )
Discussion Questions • How can these findings be incorporated into our current planning processes? If not already, how can they be incorporated into our program review or SLO processes for CTE programs? • How can we dig deeper into these results to better understand our CTE student population? What else do we want to know about them that we did not find out in the survey? How can we capture this information? Then, how can we use it? • How can we use the information we have to inform changes in our current practices? What changes can be made this year, over the next year, over the next five years? (Note: These are possible discussion questions that can be included or removed based on your audience.
Questions? <Your Name and Contact Information> Additional Resources CTE Outcomes Survey website: http://www.rpgroup.org/projects/CTE-Employment-Outcomes-Survey CTE User Guide: http://www.rpgroup.org/resources/resources-using-results