Download
1 / 7

E N D
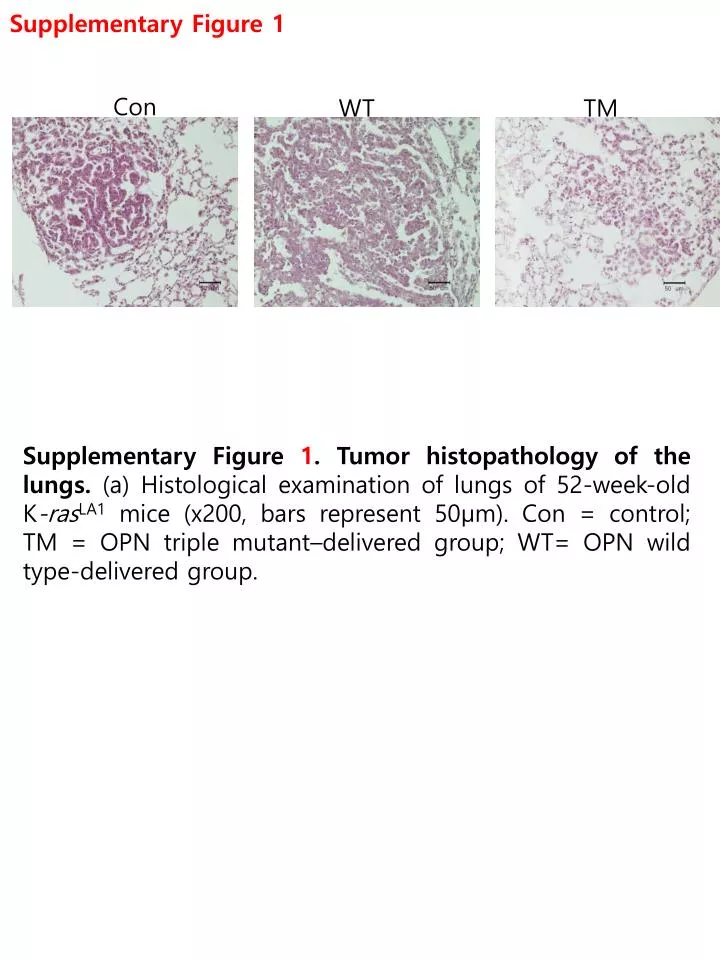
Supplementary Figure 1 Con WT TM Supplementary Figure 1. Tumor histopathology of the lungs. (a) Histological examination of lungs of 52-week-old K-rasLA1 mice (x200, bars represent 50µm). Con = control; TM = OPN triple mutant–delivered group; WT= OPN wild type-delivered group.
Supplementary Figure 2 (continued) c Supplementary Figure 2. Effects of lentivirus-mediated OPN TM on GALNAc-T1, GALNAc-T2 and OPN expression level. (a) Quantitative real-time PCR analysis of GALNAc-T1 in the lungs of K-rasLA1mice. (b) Quantitative real-time PCR analysis of GALNAc-T2 in the lungs of K-rasLA1mice. (c) Quantitative real-time PCR analysis of OPN in the lungs of K-rasLA1mice.Each barrepresents the mean ± SEM (n = 3). CONTROL = control mice; VECTOR = vector control; OPN TM = OPN TM-delivered group.
Supplementary Figure 3 a OPN Con Vec WT TM Akt p-Akt (Ser473) IKKα/β β α p-mTOR p-p70S6K p-4E-BP1 GAPDH
Supplementary Figure 3 (continued) b Supplementary Figure 3. Effectsof OPN WT and OPN TMon the OPN-mediated signaling pathway in LA-4 cells. (a)Western blot analysis of Akt, p-Akt at Ser473, IKKα/β, p-mTOR, p-p70S6K, p-4E-BP1 in LA4 cells infected with OPNWT/TM. (b) ELISA of OPN. LA-4cells were infectedwith OPN WT/TM and then treated with PMSF (0.5 mM), then, cultured media were collected and ELISA was performed. Each bar represents the mean±SEM (n = 3). *p < 0.05 vs. Con ,+p < 0.05 vs. TM , #p < 0.05 vs WT and WT+PMSF. Con = non-treated cells; Vec = vector control; WT = OPN WT-infected cells; TM = OPN TM-infected cells
Supplementary Figure 4 a b Supplementary Figure 4. Effectsof rapamycin and PDTC incells infected with OPN TM and OPN WT. (a) Dual luciferase assay. LA-4 cells were transfected with the bicistronic reporter construct pcDNAfLUC-polIRES-rLUC following infection with OPN lentiviralconstructs (vector only, OPN-WT, and OPN-TM) and then treated with rapamycin (100 nM)or left untreated. *p < 0.05 vs. Con , #p < 0.05 vs WT, $p<0.05 vs TM, +p <0.05 vs other treated group (b)Dual luciferase assay. LA-4 cells were transfected with the NF-κB luciferase vector andthe pRA-SV40 control vector following infection with OPNlentiviralconstructs (vector only, OPN-WT, and OPN-TM) and then treated with PDTCor left untreated.Each bar represents the mean±SEM(n = 3). *p < 0.05 vs. Con , #p < 0.05 vs WT, +p <0.05 vs other treated group. Con = non-treated cells; Vec = vector control; WT = OPN WT-infected cells; TM = OPN TM-infected cells
Supplementary Figure 5 a b Supplementary Figure 5.Effects of lentivirus-mediated OPN TM and OPN WT on GALNAc-T1 and GALNAc-T2 expression level. (a) Quantitative real-time PCR analysis of GALNAc-T1 in LA-4 cells infected with OPNWT/TM (b) Quantitative real-time PCR analysis of GALNAc-T2 in LA-4 cells infected with OPNWT/TM. Each barrepresents the mean ± SEM (n = 3). CONTROL = non-treated cells; WT = OPN WT-infected cells; TM = OPN TM-infected cells