Download
1 / 49
490 likes | 637 Views
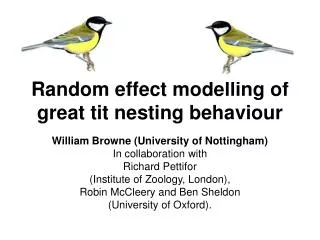
Random effect modelling of great tit nesting behaviour. William Browne (University of Bristol) In collaboration with Richard Pettifor (Institute of Zoology, London), Robin McCleery and Ben Sheldon (University of Oxford) And Dylan Childs (University of Sheffield). Talk Summary.

E N D
Random effect modelling of great tit nesting behaviour William Browne (University of Bristol) In collaboration with Richard Pettifor (Institute of Zoology, London), Robin McCleery and Ben Sheldon (University of Oxford) And Dylan Childs (University of Sheffield).
Talk Summary • Background. • Wytham woods great tit dataset. • Partitioning variability in responses. • Partitioning correlation between responses. • Prior sensitivity. • MCMC efficiency. • Including individual nestling responses.
Statistical Modelling • Statistical modelling is used to infer hypotheses from data i.e. to use data collected to explore relationships between parameters. • A statistical model contains: • Data - y • Parameters - Θ (can be interesting or nuisance) • Likelihood L(y; Θ) – a function that states how likely the data is given we have particular values of parameters Θ.
Bayesian Statistics • A sequential updating approach: • We have some ‘prior’ belief or knowledge about our parameters • We collect some data and find the likelihood of the data given the parameter values • We work with the posterior where • Posterior = Prior x Likelihood • i.e. we combine our prior knowledge and the data to come up with new ‘posterior’ belief. • We will do this with statistical distributions i.e.
MCMC methods • In Bayesian statistics we construct the posterior distribution and make inferences from this. • Generally Θ consists of many parameters and so p(Θ|y) is hard to calculate. • If we consider then it might be easier to consider each θi in turn and find the conditional posteriors P(θi | y, θ-i ) which is easier to do. • MCMC methods basically simulate random draws from the conditional posterior distributions in turn and use these simulated values as a set of (dependent) samples from the true posterior p(Θ|y)
Statistical Analysis of Bird Ecology Datasets • Much recent work done on estimating population parameters, for example estimating population size, survival rates. • Much statistical work carried out at Kent, Cambridge and St Andrews. • Data from census data and ring-recovery data. • Less statistical work on estimating relationships at the individual bird level, for example: Why do birds laying earlier lay larger clutches? • Difficulties in taking measurements in observational studies, in particular getting measurements over time due to short lifespan of birds.
Wytham woods great tit dataset • A longitudinal study of great tits nesting in Wytham Woods, Oxfordshire. • 6 responses : 3 continuous & 3 binary. • Clutch size, lay date and mean nestling mass. • Nest success, male and female survival. • Data: 4165 nesting attempts over a period of 34 years. • There are 4 higher-level classifications of the data: female parent, male parent, nestbox and year.
Source Number of IDs Median #obs Mean #obs Year 34 104 122.5 Nestbox 968 4 4.30 Male parent 2986 1 1.39 Female parent 2944 1 1.41 Data background The data structure can be summarised as follows: Note there is very little information on each individual male and female bird but we can get some estimates of variability via a random effects model.
Univariate cross-classified random effect modelling • For each of the 6 responses we will firstly fit a univariate model, normal responses for the continuous variables and probit regression for the binary variables. For example using notation of Browne et al. (2001) and letting response y be clutch size:
Estimation • We use MCMC estimation in MLwiN and choose ‘diffuse’ priors for all parameters. • We run 3 chains from different starting points for 250k iterations each (500k for binary responses) and use Gelman-Rubin diagnostic to decide burn-in length. • For the normal responses we compared results with the equivalent classical model in Genstat. Note although Genstat can also fit the binary response models it couldn’t handle the large numbers of random effects. • We fit all four higher classifications and do not consider model comparison.
Clutch Size Here we see that the average clutch size is just below 9 eggs with large variability between female birds and some variability between years. Male birds and nest boxes have less impact.
Lay Date (days after April 1st) Here we see that the mean lay date is around the end of April/beginning of May. The biggest driver of lay date is the year which is probably indicating weather differences. There is some variability due to female birds but little impact of nest box and male bird.
Nestling Mass Here the response is the average mass of the chicks in a brood. Note here lots of the variability is unexplained and both parents are equally important.
Human example Helena Jayne Browne Born 22nd May 2006 Birth Weight 8lb 0oz Sarah Victoria Browne Born 20th July 2004 Birth Weight 6lb 6oz Father’s birth weight 9lb 13oz, Mother’s birth weight 6lb 8oz
Nest Success Here we define nest success as one of the ringed nestlings captured in later years. The value 0.01 for β corresponds to around a 50% success rate. Most of the variability is explained by the Binomial assumption with the bulk of the over-dispersion mainly due to yearly differences.
Male Survival Here male survival is defined as being observed breeding in later years. The average probability is 0.334 and there is very little over-dispersion with differences between years being the main factor. Note the actual response is being observed breeding in later years and so the real probability is higher!
Female survival Here female survival is defined as being observed breeding in later years. The average probability is 0.381 and again there isn’t much over-dispersion with differences between nestboxes and years being the main factors.
Multivariate modelling of the great tit dataset • We now wish to combine the six univariate models into one big model that will also account for the correlations between the responses. • We choose a MV Normal model and use latent variables (Chib and Greenburg, 1998) for the 3 binary responses that take positive values if the response is 1 and negative values if the response is 0. • We are then left with a 6-vector for each observation consisting of the 3 continuous responses and 3 latent variables. The latent variables are estimated as an additional step in the MCMC algorithm and for identifiability the elements of the level 1 variance matrix that correspond to their variances are constrained to equal 1.
Multivariate Model Here the vector valued response is decomposed into a mean vector plus random effects for each classification. Inverse Wishart priors are used for each of the classification variance matrices. The values are based on considering overall variability in each response and assuming an equal split for the 5 classifications.
Use of the multivariate model • The multivariate model was fitted using an MCMC algorithm programmed into the MLwiN package which consists of Gibbs sampling steps for all parameters apart from the level 1 variance matrix which requires Metropolis sampling (see Browne 2006). • The multivariate model will give variance estimates in line with the 6 univariate models. • In addition the covariances/correlations at each level can be assessed to look at how correlations are partitioned.
Correlations in full model Note numbers give correlations in a 1 level model. Key: Blue +ve, Red –ve: Y – year, N – nestbox, F – female, O - observation
Pairs of antagonistic covariances at different classifications There are 3 pairs of antagonistic correlations i.e. correlations with different signs at different classifications: CS & FS : Female 0.48 Observation -0.20 Interpretation: Birds that lay larger clutches are more likely to survive but a particular bird has less chance of surviving if it lays more eggs. LD & FS : Female -0.67 Observation 0.11 Interpretation: Birds that lay early are more likely to survive but for a particular bird the later they lay the better! LD & NM : Female 0.20 Observation -0.19 Interpretation: Females who generally lay late, lay heavier chicks but the later a particular bird lays the lighter its chicks.
Prior Sensitivity Our choice of variance prior assumes a priori • No correlation between the 6 traits. • Variance for each trait is split equally between the 5 classifications. We compared this approach with a more Bayesian approach by splitting the data into 2 halves: In the first 17 years (1964-1980) there were 1,116 observations whilst in the second 17 years (1981-1997) there were 3,049 observations We therefore used estimates from the first 17 years of the data to give a prior for the second 17 years and compared this prior with our earlier prior. Both approaches give similar results.
MCMC efficiency for clutch size response • The MCMC algorithm used in the univariate analysis of clutch size was a simple 10-step Gibbs sampling algorithm. • The same Gibbs sampling algorithm can be used in both the MLwiN and WinBUGS software packages and we ran both for 50,000 iterations. • To compare methods for each parameter we can look at the effective sample sizes (ESS) which give an estimate of how many ‘independent samples we have’ for each parameter as opposed to 50,000 dependent samples. • ESS = # of iterations/,
Parameter MLwiN WinBUGS Fixed Effect 671 602 Year 30632 29604 Nestbox 833 788 Male 36 33 Female 3098 3685 Observation 110 135 Time 519s 2601s Effective Sample sizes The effective sample sizes are similar for both packages. Note that MLwiN is 5 times quicker!! We will now consider methods that will improve the ESS values for particular parameters. We will firstly consider the fixed effect parameter.
Trace and autocorrelation plots for fixed effect using standard Gibbs sampling algorithm
Hierarchical Centering This method was devised by Gelfand et al. (1995) for use in nested models. Basically (where feasible) parameters are moved up the hierarchy in a model reformulation. For example: is equivalent to The motivation here is we remove the strong negative correlation between the fixed and random effects by reformulation.
Hierarchical Centering In our cross-classified model we have 4 possible hierarchies up which we can move parameters. We have chosen to move the fixed effect up the year hierarchy as it’s variance had biggest ESS although this choice is rather arbitrary. The ESS for the fixed effect increases 50-fold from 602 to 35,063 while for the year level variance we have a smaller improvement from 29,604 to 34,626. Note this formulation also runs faster 1864s vs 2601s (in WinBUGS).
Trace and autocorrelation plots for fixed effect using hierarchical centering formulation
Parameter Expansion • We next consider the variances and in particular the between-male bird variance. • When the posterior distribution of a variance parameter has some mass near zero this can hamper the mixing of the chains for both the variance parameter and the associated random effects. • The pictures over the page illustrate such poor mixing. • One solution is parameter expansion (Liu et al. 1998). • In this method we add an extra parameter to the model to improve mixing.
Trace plots for between males variance and a sample male effect using standard Gibbs sampling algorithm
Autocorrelation plot for male variance and a sample male effect using standard Gibbs sampling algorithm
Parameter Expansion In our example we use parameter expansion for all 4 hierarchies. Note the parameters have an impact on both the random effects and their variance. The original parameters can be found by: Note the models are not identical as we now have different prior distributions for the variances.
Parameter Expansion • For the between males variance we have a 20-fold increase in ESS from 33 to 600. • The parameter expanded model has different prior distributions for the variances although these priors are still ‘diffuse’. • It should be noted that the point and interval estimate of the level 2 variance has changed from • 0.034 (0.002,0.126) to 0.064 (0.000,0.172). • Parameter expansion is computationally slower 3662s vs 2601s for our example.
Trace plots for between males variance and a sample male effect using parameter expansion.
Autocorrelation plot for male variance and a sample male effect using parameter expansion.
Parameter WinBUGS originally WinBUGS combined Fixed Effect 602 34296 Year 29604 34817 Nestbox 788 5170 Male 33 557 Female 3685 8580 Observation 135 1431 Time 2601s 2526s Combining the two methods Hierarchical centering and parameter expansion can easily be combined in the same model. We performed centering on the year classification and parameter expansion on the other 3 hierarchies and got the following.
Including responses on individual chick survival • In our earlier modelling we consider a response ‘nest success’ that indicates that one (or more) chicks survive to breed. This fitted nicely into the normal/probit binomial modelling framework. • We would prefer to distinguish between nesting attempts where just one bird survives and those where lots survive. • We can easily fit separate models for each response and include higher level correlations. To capture the lower level correlations we can instead fit responses as predictors.
Including responses on individual chick survival • Here we consider a different subset of the Wytham Woods dataset (4864 attempts over 28 years (1976-2003) and 3,338 female birds). Note nestboxes replaced in mid 1970s with concrete boxes. • For illustration we consider the 2 classifications: year and female, and three responses: clutch size, female survival and nestling survival. Note these are minimal sets for usage in an interesting population model. • We will use WinBUGS to fit this model as currently MLwiN cannot fit general models with responses of different types. • We also use the logit link instead of the probit (due to problems in WinBUGS with the probit).
Model for three responses The following model was fitted (with the addition of non-informative priors as previously). Note that the two fixed effects, β3 and β4 capture the level 1 correlations (but we do not model correlation between FS & NS at level 1).
Results – fixed effects Below we fill in the fixed effects estimates for the three responses. We see clearly the ‘penalty’ terms for increasing clutch size, in particular on female survival. We can express the survival terms as probabilities as follows:
Results - Covariances Below we give the between female and between year covariance matrices with responses in the order CS, FS & NS: We can see that clutch size and female survival is more influenced by female birds whilst nestling survival is more influenced by year. We see that all correlations are positive suggesting birds in better condition lay larger clutches and are more likely to survive. There are particularly strong correlations between clutch size and female survival between females and the two survival variables between years.
Results – year effects Here we see the random effects for the three responses for the 28 years. There is positive correlation between the three responses in particular between the two survivals (0.83).
Further work with Dylan Childs: Using year effects in a population model • Population model aims to look at dynamic behaviour of population over time and look for ‘optimal’ strategies. • The values of the year random effects can be used as known constants in the population model to focus the model on the time period studied or alternatively year random effects can be drawn from the variance-covariance matrix to simulate ‘typical’ years. • The model can be expanded to incorporate dispersal of birds from Wytham, egg survival in the nest, fledgling survival and adult survival.
Using the estimates: Estimation of an optimal strategy * • The adult cost of reproduction (*) is very hard to detect using population level analyses • It appears to be an important component of fitness.
Conclusions • In this talk we have considered analysing observational bird ecology data using complex random effect models. • We have seen how these models can be used to partition both variability and correlation between various classifications to identify interesting relationships. • We then investigated hierarchical centering and parameter expansion for a model for one of our responses. These are both useful methods for improving mixing when using MCMC. • We finally looked at how to incorporate individual fledgling survival in our models. This will be useful for fitting population models in the future.
References • Browne, W.J. (2004). An illustration of the use of reparameterisation methods for improving MCMC efficiency in crossed random effect models. Multilevel Modelling Newsletter16 (1): 13-25 • Browne, W.J., McCleery, R.H., Sheldon, B.C., and Pettifor, R.A. (2007). Using cross-classified multivariate mixed response models with application to the reproductive success of great tits (Parus Major). To appear in Statistical Modelling • Browne, W.J. (2002). MCMC Estimation in MLwiN. London: Institute of Education, University of London • Browne, W.J. (2006). MCMC Estimation of ‘constrained’ variance matrices with applications in multilevel modelling. Computational Statistics and Data Analysis. 50: 1655-1677. • Browne, W.J., Goldstein, H. and Rasbash, J. (2001). Multiple membership multiple classification (MMMC) models. Statistical Modelling1: 103-124. • Chib, S. and Greenburg, E. (1998). Analysis of multivariate probit models. Biometrika85, 347-361. • Gelfand A.E., Sahu S.K., and Carlin B.P. (1995). Efficient Parametrizations For Normal Linear Mixed Models. Biometrika82 (3): 479-488. • Kass, R.E., Carlin, B.P., Gelman, A. and Neal, R. (1998). Markov chain Monte Carlo in practice: a roundtable discussion. American Statistician, 52, 93-100. • Liu, C., Rubin, D.B., and Wu, Y.N. (1998) Parameter expansion to accelerate EM: The PX-EM algorithm. Biometrika85 (4): 755-770.