Download
1 / 38
380 likes | 702 Views
Demand. Laugher Curve. Q. What do you get when you cross the Godfather with an economist? A. An offer you can't understand. . Demand. Demand means the willingness and capacity to pay. Prices are the tools by which the market coordinates individual desires. Demand vs. Quantity Demanded.

E N D
Laugher Curve Q. What do you get when you cross the Godfather with an economist? A. An offer you can't understand.
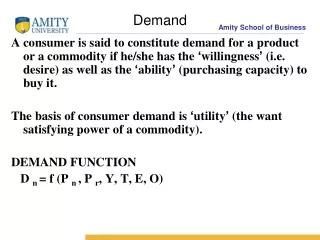
Demand • Demand means the willingness and capacity to pay. • Prices are the tools by which the market coordinates individual desires.
Demand vs. Quantity Demanded • Demand is the amount of a product that people are willing and able to purchase at each possible price during a given period of time. • The quantity demand is the amount of a product that people are willing and able to purchase at one, specific price.
The Law of Demand • Law of demand – there is an inverse relationship between price and quantity demanded. • Quantity demanded rises as price falls, other things constant. • Quantity demanded falls as prices rise, other things constant.
The Law of Demand • What accounts for the law of demand? • People tend to substitute for goods whose price has gone up.
The Demand Curve • The demand curve is the graphic representation of the law of demand. • The demand curve slopes downward and to the right. • As the price goes up, the quantity demanded goes down.
The Demand Table • The demand table assumes all the following: • As price rises, quantity demanded declines. • Quantity demanded has a specific time dimension to it. • All the products involved are identical in shape, size, quality, etc.
The Demand Table • The demand table assumes all the following: • The schedule assumes that everything else is held constant.
From a Demand Table to a Demand Curve • You plot each point in the demand table on a graph and connect the points to derive the demand curve.
From a Demand Table to a Demand Curve • The demand curve graphically conveys the same information that is on the demand table.
A Demand Table Price per cassette DVD rentals demanded per week E G D A B C D E $0.501.00 2.00 3.00 4.00 9 8 6 4 2 Demand for DVDs C F B A From a Demand Table to a Demand Curve A Demand Curve $6.00 5.00 4.00 3.50 Price per DVDs (in dollars) 3.00 2.00 1.00 .50 0 1 2 3 4 5 6 7 8 9 10 11 12 13 Quantity of DVDs demanded (per week)
A PA Price (per unit) D 0 QA Quantity demanded (per unit of time) A Sample Demand Curve
Other Things Constant • Other things constant places a limitation on the application of the law of demand. • All other factors that affect quantity demanded are assumed to remain constant, whether they actually remain constant or not.
Other Things Constant • Other things constant places a limitation on the application of the law of demand. • These factors may include changing tastes, prices of other goods, income, even the weather.
Shifts in Demand Versus Movements Along a Demand Curve • Demand refers to a schedule of quantities of a good that will be bought per unit of time at various prices, other things constant. • Graphically, it refers to the entire demand curve.
Shifts in Demand Versus Movements Along a Demand Curve • Quantity demanded refers to a specific amount that will be demand per unit of time at a specific price. • Graphically, it refers to a specific point on the demand curve.
Shifts in Demand Versus Movements Along a Demand Curve • A movement along a demand curve is the graphical representation of the effect of a change in price on the quantity demanded.
Shifts in Demand Versus Movements Along a Demand Curve • A shift in demand is the graphical representation of the effect of anything other than price on demand.
B $2 Change in quantity demanded (a movement along the curve) Price (per unit) A $1 0 100 200 Quantity demanded (per unit of time) Change in Quantity Demanded D1
Change in demand (a shift of the curve) $2 Price (per unit) B A $1 D0 D1 100 200 Quantity demanded (per unit of time) Shift in Demand 250
Determinants of Demand Number of buyers Income Tastes Expectations Prices of related goods
Shift Factors of Demand • Shift factors of demand are factors that cause shifts in the demand curve: • Society's income. • The prices of other goods. • Tastes. • Expectations. • Number of Buyers • Taxes on subsidies to consumers.
Income • An increase in income will increase demand for normal goods. • An increase in income will decrease demand for inferior goods.
Price of Other Goods • When the price of a substitute good falls, demand falls for the good whose price has not changed. • When the price of a complement good falls, demand rises for the good whose price has not changed.
Tastes • A change in taste will change demand with no change in price.
Expectations • If you expect your income to rise, you may consume more now. • If you expect prices to fall in the future, you may put off purchases today.
Individual and Market Demand Curves • A market demand curve is the horizontal sum of all individual demand curves. • This is determined by adding the individual demand curves of all the demanders.
Individual and Market Demand Curves • Sellers estimate total market demand for their product which becomes smooth and downward sloping curve.
$4.00 (1) Price per cassette (2) Alice’s demand (3) Bruce’s demand (2) Cathy’s demand (3) Market demand G 3.50 F 3.00 E A B C D E F G H $.0.50 1.00 1.50 2.00 2.50 3.00 3.50 4.00 9 8 7 6 5 4 3 2 6 5 4 3 2 1 0 0 1 1 0 0 0 0 0 0 16 14 11 9 7 5 3 2 2.50 D 2.00 Price per cassette (in dollars) C 1.50 B 1.00 A 0.50 Cathy Bruce Alice 0 2 4 6 8 10 12 14 16 Quantity of cassettes demanded per week From Individual Demandsto a Market Demand Curve Market demand McGraw-Hill/Irwin © 2004 The McGraw-Hill Companies, Inc., All RightsReserved.
Taxes and Subsidies • Taxes levied on consumers increase the cost of goods to consumers, thereby reducing demand. • Subsidies have an opposite effect.
Changes in Demandand Quantity Demanded • Change in Quantity Demanded - movement along the same demand curve in response to a price change. • Change in Demand - shift in entire demand curve in response to a change in a determinant of demand (a ceteris paribus variable)
The Law of Demand • The demand curve is downward sloping for the following reasons: • At lower prices, existing demanders buy more. • At lower prices, new demanders enter the market.