Download
1 / 24
240 likes | 243 Views
Learn how to effectively deal with uncertainty in business decisions by modeling and managing risk. Explore techniques to compute expected costs and benefits and minimize error costs. Understand the trade-off of pricing strategies and how to avoid discrimination against high-value customers. Discover the value of collecting more information and using difference-in-difference estimators to make informed decisions.

E N D
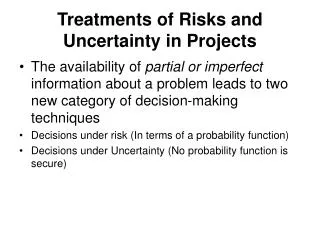
Summary of main points • When you’re uncertain about the costs or benefits of a decision, replace numbers with random variables and compute expected costs and benefits. • Uncertainty in pricing: When customers have unknown values, you face a familiar trade-off: Price high and sell only to high-value customers, or price low and sell to all customers. • If you can identify high-value and low-value customers, you can price discriminate and avoid the trade-off. To avoid being discriminated against, high-value customers will try to mimic the behavior and appearance of low-value customers.
Summary of main points (cont.) • Difference-in-difference estimators are a good way to gather information about the benefits and costs of a decision. The first difference is before versus after the decision or event. The second difference is the difference between a control and an experimental group. • If you are facing a decision in which one of your alternatives would work well in one state of the world, and you are uncertain about which state of the world you are in, think about how to minimize expected error costs.
Introductory anecdote: TeleSwitch • A large telecom supplier, TeleSwitch, sold its product only through distributors. • In 2000, their largest clients wanted to deal directly with TeleSwitch – and avoid the middle man distributor. TeleSwitch was unsure what to do. • They might lose large customers if they didn’t switch. • But, they might lose distributors (and their small customers) if they did. • There is a lower probability of losing dealers (because they would have to incur costs to change suppliers) • But this would have a much larger impact on profit. • How should we analyze decisions like this??
Introduction: Uncertainty • This problem illustrates the type of uncertainty that exist in most business decisions. • This chapter looks at ways to help deal with uncertainty and arrive at decisions that will best profit your firm. • By modeling uncertainty, you can: • Learn to make better decisions • Identify the source(s) of risk in a decisions • Compute the value of collecting more information.
Modeling Uncertainty • To model uncertainty we use random variables to compute the expected costs and benefits of a decision. • Definition: a random variable is simply a way of representing numerical outcomes that occur with different probabilities. • To represent values that are uncertain, • list the possible values the variable could take, • assign a probability to each value, and • compute the expected values (average outcomes) by calculating a weighted average using the probabilities as the weights.
Random variables • Definition: a binomial random variable, X, can have two values, x1 or x2, with probabilities, p and 1-p. The expected value (mean) for a binomial random variable is: E[X]=p*x1+(1-p)x2 • Definition: a trinomial random variable, X, can have three values, x1,x2, or x3, with probabilities p1, p2, and 1-p1–p2. The mean for a trinomial random variable is: E[X]= p1*x1+ p2*x2+(1- p1-p2) x3
How to model uncertainty • “Wheel of Cash” example: • The carnival game wheel is divided like a pie into thirds, with values of $100, $75, and $5 painted on each of the slices • The cost to play is $50.00 • Should you play the game? • Three possible outcomes: $100, $75, and $5 with equal probability of occurring (assuming the wheel is “fair”) • Expected value of playing the game is 1/3 ($100) + 1/3 ($75) + 1/3 ($5) = $60 • But, if the wheel is biased toward the $5 outcome, the expected value is 1/6 ($100) + 1/6 ($75) + 2/3 ($5) = $32.50
TeleSwitch’s Decision Tree • The probability of losing customers is 0.6 • The probability of losing distributors is 0.2
Entry Decision with Uncertainty • The probability of retaliation (no accommodation) to an entry decision (as modeled in ch 15) is 0.5
Dealing with uncertainty • Discussion: How do you respond to an invitation from a friend to invest in a real estate venture that depends on uncertain future demand and interest rates? • Calculate the potential gains and loses based on different combinations of high and low interest rates and high and low demand • Whoever proposed the venture probably presented the best case scenario (low interest rates and high demand) – and that is the only combination (of four possible outcomes) under which you will do well. • Either don’t invest or find a way that aligns your friend’s incentives with your own, i.e., he gets a payoff only if the venture does well.
Uncertainty in Pricing • Uncertainty in pricing arises when the demand for a product is unknown. • To model this uncertainty, classify the number and type of potential customers. For example: • High-value consumers willing to pay $8 • Low-value consumers willing to pay $5 • Suppose there are equal numbers of each consumer group • Discussion: If MC= $3, what is optimal price? • By pricing high, you would earn $5 per sale each time a high-value costumer shops – or %50 of the time • By pricing low, you would earn $2 per sale but would be able to sell to both high- and low-value costumers – 100% of the time.
Uncertainty in Pricing (cont.) • Answer: Price High
Price Discrimination Opportunity • If you can identify the two types of customers, set different prices to each group, and prevent arbitrage between them, then you can price discriminate. • Price of $8 to the high-value customers • Price of $5 to the low-value customers. • Discussion: When buying a new car, sales people discriminate between high- and low-value customers. How do they do this? • Discussion: What can you do to defeat this?
Natural experiments • To gather information about the benefits and costs of a decision you can run natural experiments. • Natural experiment example: A national restaurant chain • A regional manager wanted to test the profitability of a special holiday menu • To do this, the menu was introduced in half the restaurants in her region. • In comparing sales between the new menu locations and the regular menu locations (the control group) the manager hoped to isolate the effect of the holiday menu on profit.
Natural experiments (cont.) • This is a difference-in-difference estimator. The first difference is before vs. after the introduction of the menu; the second difference is the experimental vs. control groups • Difference-in-difference controls for unobserved factors that can influence changes • The manager found that sales jumped during the holiday season – but the increase was seen both in the control and experimental groups—both increased by the same amount. • The manager concluded that the holiday menu’s popularity came at the expense of the regular menu. So the holiday menu only cannibalized the regular menu’s demand and didn’t attract new customers to the restaurant.
Natural experiments (cont.) • Natural experiments can be useful in many different contexts. • When the FTC looked back at a 1998 gasoline merger in Louisville, they used their own version of a difference-in-difference estimator. • Three control cities (Chicago, Houston, and Arlington) were used to control for demand and supply shocks that could affect price. • The first difference was before vs. after the merger; the second difference was Louisville prices vs. prices in control cities– this allowed the FTC to isolate the effects of the merger and determine its effect
Minimizing expected error costs • Sometimes, when faced with a decision, instead of focusing on maximizing expected profits (benefits minus costs) it can be useful to think about minimizing expected“error costs.” • This approach is helpful when one alternative would work well only under certain conditions, and you are uncertain about whether the conditions hold. • For example, “should we impose a carbon tax?” • If global warming is caused by human activity then a carbon tax will help reduce it. • But if global warming is not caused by human activity, then a carbon tax would only reduce economic activity and would not cool the Earth.
Error costs (cont.) • The two global warming alternatives can be modeled by: • Type I error is the failure to tax when global warming (GW) is caused by human activity. • The Type II error is the implementation of a carbon tax when global warming (GW) is not caused by human activity. • The optimal decision is the one with the smaller expected error costs, i.e. Tax if (1-p)*Cost(Type I) < p*Cost(Type II) • This type of analysis is especially useful for balancing the risks associated with pricing errors (over- v. under-), e.g., for airlines, hotels, cruise ships; as well as production errors (over v. under)
Risk versus uncertainty • Risk is how we characterize uncertainty about values that are variable. • Risk is modeled using random variables. • Uncertainty is uncertainty about the about the distribution of the random variables. • E.g., which probabilities should be assigned to the various values the random variables can take? • This difference is critical in financial markets. Risk can be predicted, priced and traded – people are comfortable with risk. Dealing with uncertainty is much more difficult. • Mistaking risk for uncertainty can be a costly mistake.
IndyMac: Risk vs. Uncertainty • Investors confused the absence of volatility with the absence of risk • Risk never went away, investors were just ignoring it • Black Swans & fat tails • I have nothing against economists: you should let them entertain each others with their theories and elegant mathematics, [But]…do not give any of them risk-management responsibilities. --Nassim Nicholas Taleb
Dealing with uncertainty • Uncertainty is unavoidable. So to cope with uncertainty in decision making, gather more or better information. • Best Buy has used dispersed sets of non-experts to predict future variables, such as a holiday sales rate. • Google uses internal prediction markets to generate demand and usage forecasting. • The US Marines advise: • Because we can never eliminate uncertainty, we must learn to fight effectively despite it. We can do this by developing simple, flexible plans; planning for likely contingencies; developing standing operating procedures; and fostering initiative among subordinates.
Alternate Intro Anecdote: Risk versus uncertainty • Part of the housing crisis can be attributed to an error in translating uncertainty to risk through a mathematical formula created by David Li. • The formula was designed to measure the correlation between returns of various assets that made up collateralized debt obligations (CDOs). • But there was uncertainty about how one asset’s failure would related to that of another asset. There was also a lack of historical data about relationships among the underlying assets. • Li’s solution was to use past credit default swap (CDS) prices as an indication of correlation returns (clever but imperfect). • CDS data came from a time when housing prices were on the rise, and the correlation changed during a period of decreasing prices. • Nearly everyone was using this formula, and… we’ve seen how it all turned out