Download
1 / 34
340 likes | 347 Views
This outline describes the measurement of charge radii using laser spectroscopy on stable isotopes, including considerations for radioactive isotopes. It explores charge radii measurements for Ga, Cu, and Zn isotopes, as well as preparation considerations for Ni isotopes. The outline also discusses electron scattering on stable isotopes and the modified Coulombic cross-section. Further analysis includes isotope shifts in atomic transitions and nuclear charge distribution differences between isotopes and isotones. The outline highlights kinks at Z=28 and N=28 isotones and provides information on rms nuclear charge radii for medium and heavy elements. The evaluation of atomic F and M factors required for measurements is also discussed. The outline points out faults in recent experimental papers and provides guidance on improving laser spectroscopy studies in the Ni region (Z=28, 29, 30, 31).

E N D
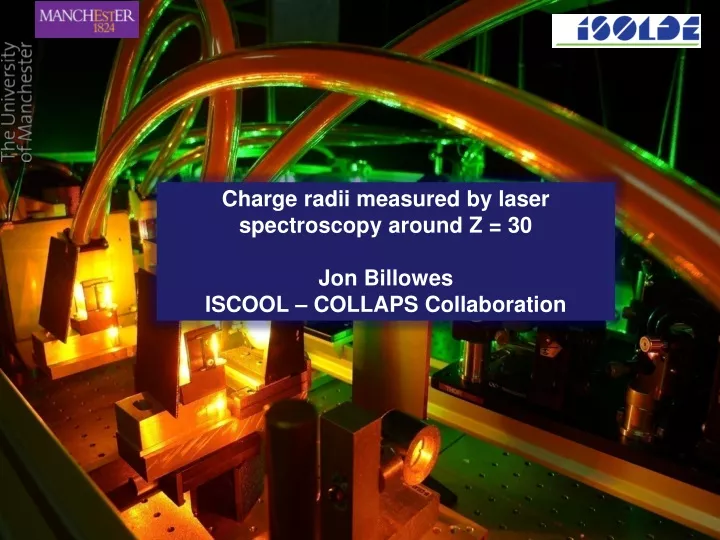
Charge radii measured by laser spectroscopy around Z = 30 Jon Billowes ISCOOL – COLLAPS Collaboration
Outline • Charge radii measurements on stable isotopes • - atomic factor calibrations • Radioactive isotopes measurements (ISCOOL – COLLAPS) • Charge radii for Ga isotopes (published) • Charge radii for Cu isotopes (to be published) • Charge radii for Zn isotopes (preliminary results) • Preparation considerations for Ni isotopes
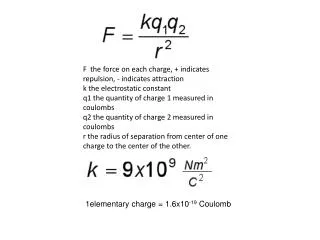
Electron scattering on stable isotopes Coulombic cross section modified by a form factor: Fourier transform of F(q) gives ρch(r) For low momentum transfer (q)
Isotope shifts in atomic transitions 6p Optical transitions (3 eV) Shift ~ 10-6 eV 6s n = 3 n = 2 K X-rays (50 keV) Shift ~ 0.1 eV n = 1 e- μ- Muonic X-rays (1 MeV) Shift ~ 5,000 eV (Theory allows absolute size measurement)
Nuclear charge distribution differences between isotopes (combined analysis of electron scattering and muonic x-ray data) Lines show upper and lower limits of differences Wohlfahrt et al Phys. Rev. C22 (1980) 264
Nuclear charge distribution differences between isotones (combined analysis of electron scattering and muonic x-ray data) Lines show upper and lower limits of differences (πf7/2)2 (πp3/2)2 Wohlfahrt et al Phys. Rev. C22 (1980) 264
“Kinks” at Z=28 and N=28 ISOTONES Wohlfahrt et al., Phys. Rev. C23 (1981) 533 ISOTOPES
rms nuclear charge radii, including radioisotopes, for medium mass and heavy elements Angeli & Marinova Atomic Data and Nuclear Data Tables 99 (2013) 69 • Features: • Kinks at closed neutron shells • Regular odd-even staggering (sometimes reversed due to nuclear structure effects) • Obvious shape effects (Light Hg, N=60…) • Radii of isotopes increase at ~half rate of 1.2A1/3 fermi (neutron rich nuclei develop neutron skin)
Isotope shift = (normal + specific) mass shift + field shift Approximate magnitudes for ΔA = 2 Element Transition Normal Specific FieldDoppler width 11Na 3s – 3p 550 MHz 200 MHz -10 MHz 1400 MHz 70Yb 6s – 6p 20 MHz ‹ 20 MHz -1500 MHz 500 MHz Light element measurement techniques should be Doppler-free. Evaluation of atomic F and M factors required.
Fricke & Heilig Nuclear Charge Radii (Springer 2004) Analysis of stable isotopes Combined analysis Result: Fi and Mi providing δ<r2> for all isotopes (including radioactive)
For optical / eμ King Plot analysis, at least three stable isotopes (two intervals) needed Zn, Ni – OK Cu, Ga – only two stable isotopes, so only a single difference in mean square charge radius. Calibration options: Calculations for F, M eg with multi-configuration Dirac-Fock (MCDF) methods. Semi-empirical methods also available for F. F normally under better control than M – so could adjust M to reproduce single difference in MSCR from combined electron/muon measurements.
Fricke & Heilig Nuclear Charge Radii (Springer 2004)Faults in recent (last two decades) experimental papers: • Tendency to focus on features of laser systems; describe “again and again origin of IS”; omit basic information on results. • Convention on sign of IS – do papers follow their convention? • Are error limits 1σ or 3σ? • Transitions are chosen for ease of laser spectroscopy and not with respect of usefulness for relevant physical result • Quoted wavelength (nm but no digits after decimal point) may not identify transition; give wavelength once and add complete description of transition. “some papers omit wavelength and give only (many times) wavenumbers!” • Give King plot with any previous work to demonstrate (or otherwise) consistency. Explain anything outside quoted errors. • Why change reference isotope from paper to paper? Use earlier literature. • Avoid odd isotope as reference (eg risk of 2nd order hyperfine mixing)
Laser spectroscopy in Ni region (Z=28, 29, 30, 31) Situation when this programme started Stable isotope Previous studies by laser spectroscopy
PSB ISCOOL – COLLAPS measurements RILIS 1.4 GeV p+ HRS ISCOOL GPS COLLAPS
Bunched-beam collinear laser spectroscopy Gas-filled linear RFQ trap CEC Ion beam cooler Laser beam Light collection region (Laser resonance fluorescence) 5μs +39.9 kV Reduces energy-spread of ion beam 40 kV Improves emittance of ion beam Trap and accumulates ions – typically for 300 ms +40 kV On-line ion source Releases ions in a 15 µs bunch Photons only counted during the 5µs when ion beam passes photomultiplier tube. 50 ms trapping = 104 reduction in background
Nuclear structure interest in Z=30 region • Migration of πf5/2 level • Spin measurements / confirmation • N=40 sub-shell effects • Test of shell model interactions (using spins, magnetic and quadrupole moments) • Radii of neutron-deficient isotopes Gallium 56Ni core JUN45 jj44b 40Ca core GXPF1 GXPF1A Matter radii
Gallium charge radii RILIS ionization scheme in ion source Fluorescence measurements Atomic structure of gallium (Z=31)
Atomic factors MCDF calculations (S. Fritzsche, Comput. Phys. Commun. 183, 1525 (2012)) F = +400 MHz.fm-2 – stable as MCDF wavefunctions enlarged M = -431 GHz.u – but no final convergence (NMS = +396 GHz.u) M adjusted to allow better fit to muonic data for 69,71Ga: M = -211(21) GHz.u
Differences in mean square charge radii for gallium Ge Ga Zn • Lépine-Szily et al., • Eur. Phys. J. A 25 227 (2005)
Copper (Z=29) isotope shifts (M.L. Bissell, T. Carette et al., to be published) Main interest: is there an effect at N=40 subshell? (parity change across N=40 reduces first-order M1 and E2 excitations, so moments do show a “magic” behaviour) Cu Measurements on 324.8 nm (2S1/22P3/2) transition Atomic factors Extensive MCDF calculations (T. Carette and M. Godefroid) F = -779 MHz.fm-2 M = 1368 GHz.u (compare with NMS = 506 GHz.u) These values approx consistent with muonic atom 65,63Cu mscr difference
Differences in mean square charge radii (Z = 28 – 32) Ge Ga Zn Cu Ni
Copper mean square charge radii after droplet model subtraction
Preliminary results for Zn charge radii Charge radii – Liang Xie (Manchester) Spins and moments – Calvin Wraith (Liverpool) Poster “Spins and moments of odd-Zn isotopes and isomers measured by collinear spectroscopy” Xiaofei Yang (Leuven)
Atomic charge exchange Zn+ + Na Zn* + Na+ + ΔE (ΔE = 0 : resonant charge exchange) ΔE is energy difference between final and initial electronic states Ionization potential Metastable state population Directly – resonant Cascade – from 3S1 state Atoms neutralised via a non-resonant higher excited state form a slower atomic beam. The laser resonance of the 481 nm transition will have a small satellite component on the low-velocity side (corresponding to a 2.58 volt shift if it is the 3S1 state that is responsible) The Zn beam can also lose quanta of 2.1 eV through inelastic collisions with Na atoms before or after neutralization. 3S1 1P1 481 nm 2.58 eV 3P2 Na Resonant charge exchange 1S0 Zn
68Zn Offset frequency (MHz)
69Zn 1/2 ground state 9/2 isomer
Ga Zn N=50 N=40 Cu
Considerations for Ni isotope measurements Ionization potential 5P2 323.4 nm many states 5D313 μs K Na 3F, 3D Ni Population of 5D3 by charge-exchange with Na at 30 keV ~4% Population of 3D2,3 states after cascade ~14%. Nothing observed in 3D1 (Paul Mantica, MSU, Private Comm.)
F and M atomic factors for Ni atom from low-lying states (D.H. Forest, Birmingham, Private Communication) Wavelength (nm) E (lower) E(upper) F (MHz fm-2) M (60-58) (MHz) cm-1 cm-1 294.3 204.8 34163.3 210(47) -820(12) 298.1 879.8 34408.6 321(6) -494(1) 298.4 0 33500.9 -1117(206) 1301(53) 299.4 204.8 33590.2 356(39) -1075(10) 300.2 204.8 33500.9 306(98) -838(25) 300.4 879.8 43164.3 241(17) -835(4) 301.9 0 33112.4 -1405(174) 1543(45) 303.2 0 32973.4 -882(81) 1166(20) 303.8 204.8 33112.4 170(30) -635(7) 305.1 204.8 32973.4 269(55) -902(13) E (lower) 0 (d)8 (s)2 204.8, 879.8 (d)9 s E(upper) (d)8 sp NMS (60-58) ~ 315 MHz Transitions from ground state are weak: 61Ni not measured, so missing from King plot
A and B hyperfine factors of low-lying states in Ni atom (Childs & Goodman, Phys.Rev. 170 (1968) 136) Energy (cm-1) A (MHz) B (MHz) 0 -215.040 -56.868 204.786 -454.972 -102.951 879.813 -171.584 -56.347 1332.153 -299.311 -42.063
Isotope shits for odd isotopes – need nuclear spin I Intervals depend onAupper, Bupper, and I, J, F J=3/2 324.8 nm J=1/2 Interval depends on Alower and I, J, F Example for I=5/2 RatioAupper/Aloweris independent of nuclear moment (ie same for all isotopes) Experimental spectrum • If the wrongvalue of I is used to fit the hyperfine structure then: • May be impossible to fit structure (position or number of peaks) • Deduced ratio Aupper/Aloweris wrong • Deduced relative peak intensities are wrong (Racah coefficients) • Isotope shift is wrong