Download
1 / 41
420 likes | 731 Views
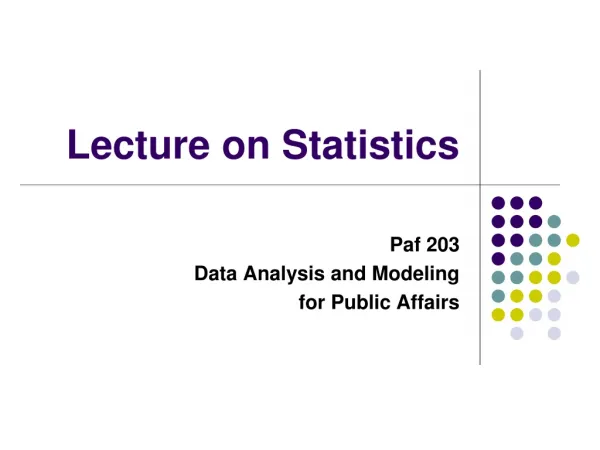
Classroom Suggestions. Using Lock5 Statistics: Unlocking the Power of Data. Patti Frazer Lock. Chapter 1: Collecting Data. Why is this first? Comes first in actual analysis More interesting than histograms and mean/median! Data! Categorical vs Quantitative Variables

E N D
Classroom Suggestions Using Lock5Statistics: Unlocking the Power of Data Patti Frazer Lock
Chapter 1: Collecting Data • Why is this first? • Comes first in actual analysis • More interesting than histograms and mean/median! • Data! • Categorical vs Quantitative Variables • Concept of a dataset with cases as rows and variables as columns • Data Collection • “Random” in random sampling does not mean haphazard! • And you can NOT do random! • Randomized experiment necessary to make conclusions about causality • ALWAYS think about how the data were collected before making conclusions
Chapter 1: Collecting Data • Focus is not on memorizing methods, but on thinking critically about how data are collected • Should be fun and interesting! (See Instructor Resources) • Relatively hard to assess • Can give only minimal coverage to some of the details if desired
Chapter 2: Describing Data • Pretty straightforward • Outline: • Single variables • Categorical • Quantitative • Relationships between variables • Two categorical • One categorical and one quantitative • Two quantitative • Discuss relevant graphs and summary statistics in each case
Chapter 2: Describing Data • All graphs and most statistics found using technology • Use interesting datasets! • Reinforce ideas from Chapter 1 • Possibly introduce StatKey or other relevant software at this point www.lock5stat.com/statkey
StatKey www.lock5stat.com/statkey
Unit A Essential Synthesis • One day • Flipped classroom • Integrate ideas from Chapters 1 and 2
Chapter 3: Confidence Intervals • Sampling variability/Sampling distributions • Concepts of “margin of error” and “standard error” • Concept of a confidence interval or interval estimate • StatKey might be helpful
StatKey www.lock5stat.com/statkey
Chapter 3: Confidence Intervals • Sampling Distribution: • Have access to entire population • Take many samples of the same size and record some statistic • Not feasible in practice! • Bootstrap Distribution • Only have one sample • Take many samples of the same size (with replacement) from that one sample and record some statistic • Feasible!! And gives same approximate shape and standard error!!
Chapter 3: Confidence Intervals • Using Bootstrap Distributions to reinforce the ideas of: • Sampling variability/Sampling distributions • Margin of error • Standard error • Interval estimate that is likely to contain the true value of the parameter
Chapter 3: Confidence Intervals • Using Bootstrap Distributions to construct confidence intervals: • Using: Statistic ± 2· SE (helps get them used to the formulas that will come later) • Using middle 95% (helps them understand confidence level)
StatKey www.lock5stat.com/statkey
StatKey Sample mean Standard Error
Using the Bootstrap Distribution to Get a Confidence Interval – Method #1 The standard deviation of the bootstrap statistics estimates the standard error of the sample statistic. Quick interval estimate : For the mean Mustang prices:
Using the Bootstrap Distribution to Get a Confidence Interval – Method #2 Chop 2.5% in each tail Keep 95% in middle Chop 2.5% in each tail We are 95% sure that the mean price for Mustangs is between $11,930 and $20,238
Chapter 3: Confidence Intervals • At the end of this chapter, students should be able to understand and interpret confidence intervals (for a variety of different parameters) • (And be able to construct them using the bootstrap method) (which is the same method for all parameters)
Chapter 4: Hypothesis Tests • State null and alternative hypotheses (for many different parameters) • Understand the idea behind a hypothesis test (stick with the null unless evidence is strong for the alternative) • Understand a p-value (!) • State the conclusion in context • (Conduct a randomization hypothesis test)
P-value: The probability of seeing results as extreme as, or more extreme than, the sample results, if the null hypothesis is true. Say what????
Example 1: Beer and Mosquitoes Does consuming beer attract mosquitoes? Experiment: 25 volunteers drank a liter of beer, 18 volunteers drank a liter of water Randomly assigned! Mosquitoes were caught in traps as they approached the volunteers.1 1Lefvre, T., et. al., “Beer Consumption Increases Human Attractiveness to Malaria Mosquitoes, ” PLoS ONE, 2010; 5(3): e9546.
Beer and Mosquitoes Number of Mosquitoes Beer 27 20 21 26 27 31 24 19 23 24 28 19 24 29 20 17 31 20 25 28 21 27 21 18 20 Does drinking beer actually attract mosquitoes, or is the difference just due to random chance? Water 21 22 15 12 21 16 19 15 24 19 23 13 22 20 24 18 20 22 H0: μB = μW Ha: μB> μW 0
Traditional Inference 1. Check conditions 5. Which theoretical distribution? 2. Which formula? 6. df? 7. find p-value 8. Interpret a decision 3. Calculate numbers and plug into formula 4. Chug with calculator 0.0005 < p-value < 0.001
Simulation Approach Number of Mosquitoes Beer 27 20 21 26 27 31 24 19 23 24 28 19 24 29 20 17 31 20 25 28 21 27 21 18 20 Does drinking beer actually attract mosquitoes, or is the difference just due to random chance? Water 21 22 15 12 21 16 19 15 24 19 23 13 22 20 24 18 20 22 H0: μB = μW Ha: μB> μW 0
Simulation Approach Number of Mosquitoes Find out how extreme these results would be, if there were no difference between beer and water. What kinds of results would we see, just by random chance (i.e. beverage doesn’t matter)? Beer 27 20 21 26 27 31 24 19 23 24 28 19 24 29 20 17 31 20 25 28 21 27 21 18 20 Water 21 22 15 12 21 16 19 15 24 19 23 13 22 20 24 18 20 22 27 21 20 22 21 15 26 12 27 21 31 16 24 19 19 15 23 24 24 19 28 23 19 13 24 22 29 20 20 24 17 18 31 20 20 22 25 28 21 27 21 18 20 Re-randomize results into Beer and Water groups
Simulation Approach Number of Mosquitoes Find out how extreme these results would be, if there were no difference between beer and water. What kinds of results would we see, just by random chance (i.e. beverage doesn’t matter)? Beer Water 20 22 21 15 26 12 27 21 31 16 24 19 19 15 23 24 24 19 28 23 19 13 24 22 29 20 20 24 17 18 31 20 20 22 25 28 21 27 21 18 20 21 27 21 20 24 19 20 24 31 13 18 24 25 21 18 15 19 16 28 22 19 27 20 23 22 21 20 26 31 19 23 15 22 12 24 29 20 27 21 17 24 20 28 Re-randomize results into Beer and Water groups StatKey Repeat MANY times
StatKey www.lock5stat.com/statkey
StatKey! www.lock5stat.com P-value
Traditional Inference 1. Which formula? 4. Which theoretical distribution? 5. df? 6. find p-value 2. Calculate numbers and plug into formula 3. Plug into calculator 0.0005 < p-value < 0.001
Beer and Mosquitoes • The Conclusion! The results seen in the experiment are very unlikely to happen just by random chance (just 1 out of 1000!) We have strong evidence that drinking beer does attract mosquitoes!
P-value: The probability of seeing results as extreme as, or more extreme than, the sample results, if the null hypothesis is true. How extreme are the sample results in the randomization distribution? Randomization distribution must assume null hypothesis is true
Chapter 4: Hypothesis Tests • State null and alternative hypotheses • Understand the idea behind a hypothesis test • Understand a p-value (!) • State the conclusion in context • Can minimize the details of how the randomization is carried out -- Important idea is that the process must assume the null hypothesis is true!
By this point in the course, students have all the key ideas of inference!!!! • Take your time through Chapters 3 and 4 • You can make up the time later – Chapters 5 and 6 go quickly!
Unit B Essential Synthesis • One day • Flipped classroom • Integrate ideas from Chapters 1 through 4
Chapter 5: Normal Distribution • Finding probabilities and cutoff values on a normal distribution • Using a distribution for confidence intervals: And hypothesis tests:
StatKey www.lock5stat.com/statkey
Chapter 6: Short-cut Formulas • Short sections can be covered in any order you want!! • Proportions or means first • One sample or two first • Confidence intervals or hypothesis tests first • Can be covered quickly! Mostly just lots of new SE formulas! Do more than one section a day!!!
StatKey Sample stats
Additional Topics • Chi-square Tests (Chapter 7) • ANOVA for difference in means (Chapter 8) • Inference for simple regression (Chapter 9) and multiple regression (Chapter 10) • These can be done in any order • (Also, probability – chapter 11 – can be omitted or covered at any point in the course)
StatKey www.lock5stat.com/statkey
Instructor Resources • PowerPoint slides for every section • Clicker questions for every section • Notes and suggestions for every section • Instructor video for every section • Class worksheet(s) for every section • Class activity for every section • Videos for every example and every learning goal • WileyPLUS (with most content designed by us) • Software manuals for R, Minitab, Fathom, Excel, SAS, TI calculators • Datasets ready to import in these formats • Test bank
Feel free to contact me or any of the authors at any time if you have any questions or suggestions for improvement. Thanks!lock5stat.com