Download
1 / 20
200 likes | 275 Views
How to work with Pivot Tables . Step by step instruction. Click the first cell in the first row and column of data. Now click insert . Click on PivotTable.

E N D
How to work with Pivot Tables Step by step instruction
Once you click on PivotTable this box will pop up. You want to make sure “Select a table or range” is selected. Also that “New Worksheet” is selected. Take a look at your spreadsheet you will see a moving dashes around all of your data. Then Click OK
This is the screen that will pop up. Now you want to select a unique identifier out of your fields for example the Student ID is different for each student so you can drag and drop Student ID to the Value box.
As you can see this is not correct. Click on “Sum of Student ID”
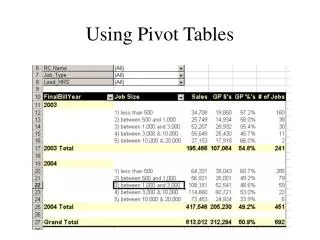
Now drag and drop “Home location” to the “Row labels” This will give you a list of home locations and the number of students at each
Now drag “Home location” to “Report filter” This will change the look of your information now you have a drop down menu that is labeled home location and the total count under count of Student ID
Now you have the group divided up by race. Now drag and drop “Ethnicity” into the Row Label box
Click on the arrow to open the drop down menu now you see all of the Campuses listed in your spreadsheet.
Click “Select Multiple items” This is will give you the option to choice one site or all
Select MCP so that the data will show you only student at the Atlanta campus
Think about what you want to know • Report Filter • Makes drop down menus • Row labels • Information is put in rows, each row is populated with information. • Column labels • Information is put in column, each column is populated with information. • Value • Give you counts, averages, min., max.