Download
1 / 53

E N D
2012 Boustead Globalisation LectureMalaysian Development Challenges:Graduating from the Middle Hal HillArndt Corden Department of EconomicsCrawford School, CAPAustralian National University Kuala Lumpur, 15 February 2012Based on my introductory chapter to the book of the same title, co-edited by Hal Hill, Tham Siew Yean and Ragayah Haji Mat Zin, Routledge, 2012Many thanks to my co-editors and the book contributors (especially Prema-Chandra Athukorala), on whose ideas I have freely drawn; to Andrew Kam for preparation of the tables and figures; and to the Australia Malaysia Institute for financial support. The usual caveat applies.
Book ContentsMohamed Ariff, Preface1. Hal Hill, Introduction INSTITUTIONS ANDGOVERNMENT2. Joan Nelson, Political Challenges in Economic Upgrading3. Terence Gomez, The Politics and Policies of Corporate Malaysia MACROECONOMIC MANAGEMENT4. Prema-chandra Athukorala, Managing Economic Crises 5. Michael Yap and Kwek Kian Teng , Monetary Policy and Financial Development 6. Suresh Narayanan, Public Sector Resource Management REFORM AND UPGRADING7. Cassey Lee, Microeconomic Reforms and Competition Policy 8. Tham Siew Yean and Loke Wai Heng, Service Sector Reforms 9. Rajah Rasiah, Technological Upgrading in Electronics? 10. Shyamala Nagaraj and Lee Kiong Hock, Education and Skills SOCIAL AND DISTRIBUTION CHALLENGES 11. Ragayah Haji Mat Zin,Poverty and Income Distribution12. Gavin Jones, Demographic and Labour Force Dynamics13. A.A. Hezri and Stephen Dovers, Environmental Challenges
(1) IntroductionSection 2 – looking backSection 3 – looking forwardTwo sub-themes:Malaysia undeniably a success story. Since Independence (1957), pci increased approximately 8-fold.Is there a disjunction in its development trajectory, post AFC, the past decade as compared to earlier periods? And if so, is this related to the challenge of ‘graduation’, and particular problems associated with the NEP and its successors?
Context(1) Are there particular challenges associated with upgrading?Eg, World Bank (2007):‘History shows that while many countries have been able to make it from low income to middle income, relatively few have carried on to high income. … A lot of complex challenges have to be met, from raising the skills and innovativeness of the labor force to creating sophisticated financial systems, to maintaining social cohesion, to greatly reducing corruption. Without these sorts of tough policy and institutional changes, countries stay where they are, unable to bust out of middle income.’(2) High level awareness in Malaysia. Eg, Prime Minister Najib, 2009:‘We are now at a critical juncture, either to remain trapped in a middle-income group or advance to a high-income economy. … We now have to shift to a new economic model based on innovation, creativity and high value added activities.’
Context (cont)(3) Academic commentary (especially on the NEP):Mohamad Ariff: ‘Multiracial Malaysia’s major structural problems are largely attributed to the NEP. [There needs to be] a clear focus on the poor and the marginalized groups regardless of race, colour or religion.’Wing Woo: ‘… by focusing too much on the redistribution of income and not enough on the generation of income, the NEP rejects meritocracy and institutionalizes racism, thereby preventing full mobilization of human resources.’(4) The international economic environment has and is likely to continue to be generally benign: Joan Nelson (2008): Malaysia’s ‘… economic policy space is surprisingly unconstrained by globalization.’ [Author’s interpretation: the result of generally sound macroeconomic policies and openness.]
(2) The Past RecordUnusual in some respects: favourable initial conditions; generally conflict-free (apart from 1950s insurgency Indonesian konfrontasi 1963-65, 1965 separation from Singapore); generally consistent policy settings.Choice of comparators?No longer Ghana or Sri Lanka!Thailand, Singapore, Korea, China chosen for illustrative purposes.The struggle to characterize the Malaysian economy and its political economy: Fisk, Myint, Ariff, Crouch, Gomez and Jomo, etc. Six Major stylized facts
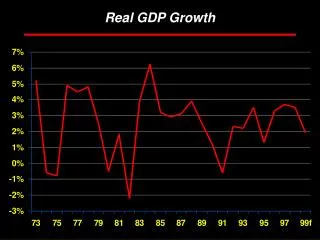
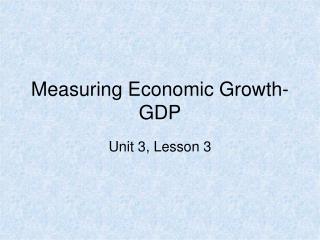
#1: Rapid economic growth Consistently high, though not quite stellar (Table 1). Eg since 1980, about half China’s. Similar to Thailand since 1990.Features as a high-growth economy in most comparative studies, eg, World Bank’s ‘Miracle Economies’, Commission on Growth & Development.Quite volatile, to be expected. No major differences across administrations (Figures 1 & 2).Some pronounced episodes, reflecting policy emphases and external shocks. Key years 1971, 1985-86, 1997-98, 2008-09. Major downturns about every decade.Some debate about productivity and TFP numbers. Table 2. Substantially input driven, but TFP numbers (Renuka, etc) difficult to interpret.
Figure 2: GDP growth, 1970-2009, Malaysia and comparators (%)
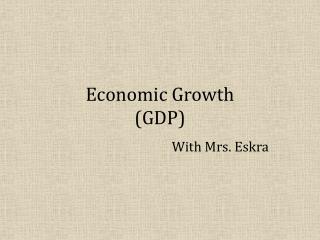
#2: Rapid structural changeConventional story, from A to M; note little change in S share. Table 3. Very similar to Thailand. Largely driven by growth; commodity prices relevant.Some policy impacts on sector shares: costly heavy industry programs, very open labour market (most open in developing world?) delayed structural change out of LI sectors.Even faster change in merchandise trade shares. Table 4. Have Malaysian exports become more or less concentrated? Depends on definitions. Table 5.A clear early mover advantage in electronics; 5th largest manufactured exporters among emerging economies. See Athukorala, 2010.
Table 3: Structural change, Malaysia and comparators, 1970-2008(% of GDP in current prices)
Table 4: Export structure, Malaysia and comparators, 1970-2009(% of total exports, excluding SITC 9)
Table 5: Concentration of exports (3 largest 3-digit SITC as % of total exports) Source: Calculated from UN COMTRADE
#3: Consistent opennessAmong the very few ‘always open’ (Sachs-Warner) economies, especially goods trade. See comparative openness indicators, Table 6.Generally low trade barriers, limited use of NTB’s, except for heavy industry, autos.Also one of the most open to FDI and labour. The latter has pros and cons. Though much slower to open services (Tham and Loke; Lee), owing to NEP and GLC’s presence.Three major political economy implications: 1) Reflects and reinforces generally good macro management. Malaysia has generally avoided BoP crises.2) Openness – the presence of a large export constituency – places a check on political excess and policy error, and exposes ‘unreformed sectors’. Central to understanding Malaysian development and its political economy. 3) Links between trade policy and NEP; the latter explains much of the low protection, ie, reluctance to protect Chinese business interests.
Table 7: Openness Indicators Source: EIU calculation derived from UNCTAD, FDI statistics, WDI
#4: Competent macroeconomic managementHighly unusual: very few serious macroeconomic problems.Almost always low inflation. Fiscal deficits mostly contained (Narayanan). BNM competent (Yap and Kwek).Figures 3 & 4: low inflation, exchange rate stability (and de facto nominal anchor), apart from 1997-98.Debt levels always manageable, mostly comfortable.External debt: two cases of rapid build up, early 1980s, 1997-98. Figure 5. Both handled effectively, avoided general debt crisis.Different circumstances, but some common explanations for successful management: fiscal deficits contained (Figures 6 & 7); high trade so low debt service ratios; macro policy credibility; high domestic savings.1980’s privatizations assisted, but at cost of poor returns to tax payers.
#4: Competent macroeconomic management (cont)Note special case of 1997/98: Malaysia the only country not to go to the IMF during the AFC. Successful ‘non-orthodox’ response, again illustrated strength of macroeconomic policy credentials (Athukorala).Response to GFC also effective; aggressive fiscal and monetary policy responses; financial sector regulation also improved as a result of the AFC. And unlike AFC, causes of GFC entirely external.But Malaysia much better as a crisis manager than as a macro manager.Some serious fiscal policy challenges (discussed again below):a) Since the AFC, deficits have become embedded in the system.b) Fiscal policy rarely counter-cyclical.c) Large, poorly targeted subsidies.d) Large, non-transparent public sector, GLC’s.Narayanan: ‘institutional leakages’.
#4: Competent macroeconomic management (cont)Two additional aspects of the macro management record:a) Malaysia has generally avoided the ‘natural resource curse’, ie that resource-rich economies tend to under-perform.Though environmental amenities not well managed (Hezri and Dovers).b) Continuing high savings provide a buffer (Ang), allow govts to be more fiscally profligate.Partly owing to the EPF, which provides the govt with access to a large, quasi-captive savings pool.Note also major changes in macro balances, (I-S), (X-M), (G-T) since AFC; discussed below.
Malaysia - Current Account (CA) and Fiscal Balance (%GDP) SOURCE: EIU
Malaysia - Gross Fixed Investment & Gross National Savings (% GDP)
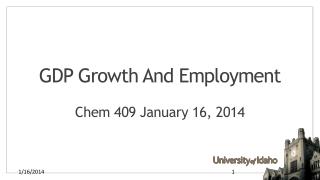
#5: Mixed social progressSignificant improvement in social indicators, but not as fast as growth, continuing high levels of inequality (Ragayah). Comparatively, on a range of indicators, about as expected (Table 6).Poverty: very rapid reduction, at least for ‘destitution’, and excluding migrant workers. See Table.Inequality (see Table): a) Declined in early years of NEP; no clear trend since late 1970s.b) Substantial decline in inter-ethnic inequality, particularly Bumi-China, from 2.3 in 1970 to 1.4 in 2009.c) Intra-Bumi inequality appears to have increased, consistent with Malaysia’s political economy.So evaluation of NEP record depends on criteria.
Gini Coefficient of H/H Income by Ethnic Groups, Malaysia: 1970 - 2007
#5: Mixed social progress (cont)The keys to rapid poverty reduction have been growth, combined with the nature of this growth (generally labour-intensive, so labour market transformed) and education expansion.In other respects, NEP not well targeted.Education (Lee and Shyamala):a) Rapid expansion, major expenditure priority.b) Record mixed on socio-economic targetting, quite high drop-out rates; also quality.c) Priorities – arguably over-invested in tertiary, at expense of primary.Public sector tertiary reform agenda: politicized, bureaucratic.Rapid private sector growth since deregulation. Malaysia set to be the Southeast Asian tertiary education hub?
#6: Institutions, political economy & ownershipHighly complex and variable picture.UMNO the longest serving political party in the world, among ‘quasi democracies’. Dominant party in coalition. All parties effectively ethnic-based.Still Crouch’s ‘responsive-repressive’? ISA, etc.Mixed record on various governance, voice, accountability measures (Table 6).Is it a ‘developmental state’ (Embong)?Yes, in some respects, openness, macro, infrastructure, etc.But not in institutional quality, civil service capability, capture, etc.Ownership patterns (see Table):Significant redistribution to Bumi community; though numbers contested.‘Dualistic’ patterns don’t appear to be changing: large MNE sector in export-oriented manufacturing; Chinese SME’s; GLC’s large in many services.No clear evidence on whether becoming more or less ‘entrepreneurial’ or ‘rent-seeking’ (Gomez, Searle).
#6: Institutions, political economy & ownership (cont)Micro-economic management less competent, more captured than macro.Slow pace of liberalization in many service sectors’ preserve of NEP/GLC’s. Limited checks on market power, especially for GLC’s.Privatizations selective and politicized (Gomez).Public sector contracting system extensive and deeply politicized.Implementation of NEP++ pragmatic, depending on economic and political circumstances. The 2010 NEM unlikely to be any different.Malaysia unusual in its absence of major U-turns in economic policy.Absence of really major economic/political crises may be a factor.Implications for ‘institutions rule’ hypothesis (Rodrik et al)? More likely the reverse causality – that openness has preserved reasonably good institutional quality.
(3) Challenges for the FutureThe general contextCurrent GNI about $7,000; long term growth rate of per capita GNI about 3.5%, so ‘graduation’ occurs in about 2030, not 2020?Very few countries outside East Asia have graduated from middle to high-income status.Some clear lessons from the literature on innovation and upgrading.See earlier World Bank quote.But the ‘middle-income trap’ literature lacks analytical content (Riedel, 2011). At high incomes, hitting frontier, convergence results in growth slowdown. Malaysia still far from the frontier. The way out of the ‘trap’ is policy reform!
Useful insights from evolutionary economics. Eg (Richard) Nelson (2008):The key to catch up is innovation. For followers, both easier and harder than (eg) Korea and Taiwan.‘Catch up will be impossible unless a country builds up its education system from bottom to top.’Rapid structural change and the Schumpeterian process of creative destruction may be painful and politically difficult in view of the ‘political power of old firms …’The Malaysian ContextNew economic model? Many things don’t need changing: openness, competent central bank, effective macroeconomic management during crises, infrastructure, universal education, etc.But growth rates since the AFC have declined. And especially, historically low levels of investment (Figure 8 above), the sharpest decline in East Asia.
Malaysian context (cont):Why the decline in I/GDP and hence growth?a) A decline to more ‘normal’ I/GDP, mid 1990s atypical? Only partly. Now back to mid 1980’s recession levels, but for over a decade.b) Recent years aberrant? No, apart from 2008-09.c) Fiscally more constrained govt? No, govt I has held up.Almost all the decline has occurred in private I/GDP. World Bank (2009):‘Malaysia’s large private surplus on the current account suggests that investors find it more attractive to invest overseas than domestically.’See also Jay Menon, 2011 on the sharp relative decline in net inward FDI.A dramatic transformation in the country’s external position: 2002 – net external liabilities 35% of GDP; 2008 – net external assets 20% of GDP.
Major challenges(1) Upgrading and innovation – some key considerations:#1 R&D, industry policy: Mixed record, public sector R&D small but rising quickly (Rasiah). Somewhat disconnected from business (ethnic factor again).Industry policy history disappointing; eg, autos, Thai success. In marked contrast to earlier agricultural successes.#2 Universities: Generously funded, but generally slipping in East Asian rankings. Mismatch with the labour market. Also somewhat politicized and bureaucratic – quotas, language policy, etc. See Salmi (2010), eg on NUS/UM comparison. Though private sector successes.#3 Dependence on foreign labour: One of the highest in the developing world. May weaken incentives for upgrading. But depends whether foreign labour is competitive or complementary with local labour. Singapore shows that upgrading with very large foreign labour force is possible (Jones).
Major challenges (cont)#4 The large GLC sector: These firms have a broader ‘developmental mission’. Some have contributed with scholarships, especially Petronas. Those in tradables forced to compete. But (a) most in non-tradables, shielded from competition; (b) politicized, little evidence that they are major technological innovators. A ‘black box’ for serious analytical research.#5 Impact of the NEP: NEP doesn’t have a technological objective. But indirect effects are large. Eg (1), Chinese SME’s seem to prefer to stay under the ICA employment threshold.Eg (2), Most large, non export-oriented firms seem to owe their existence substantially to patronage (Gomez). Though exceptions, eg AirAsia.#6 Brain drain: Difficult to estimate, no official stats, but Malaysia continues to have a large exodus of skilled professionals, many one-way migrants.
Major challenges (cont)#7 Institutional reform: Has microeconomic and institutional reform slowed, Malaysia become ‘sclerotic’ (a la Olson)? Eg, in the contract system, subsidies; the legal system (especially under Mahathir); development of independent regulatory agencies acting in the public interest; competition policy and regulatory reform (though Malaysia scores well on some, see table). The civil service: expanded rapidly, partly to solve high Bumi grad unemployment.Can it effectively regulate a largely foreign and non-Bumi private sector?It is meeting international benchmarks and attracting the best & brightest?But the governance success stories are very close to home – Penang! See Chet Singh (2011): success as much in spite of as because of the federal govt.
(2) Macroeconomic ManagementGenerally competent, especially BNM and monetary policy.Public debt/GDP about 55%, relatively modest by current OECD standards, mostly domestic.R. Thillainathan: very good macroeconomic management ‘except for a few lapses’.Zainal Aznam Yusof: policy consistently characterized by ‘learning by doing, an absence of a fixation on ideology, a good measure of pragmatism, and a continuing obsession with growth and distribution/’