Download
1 / 23
230 likes | 469 Views
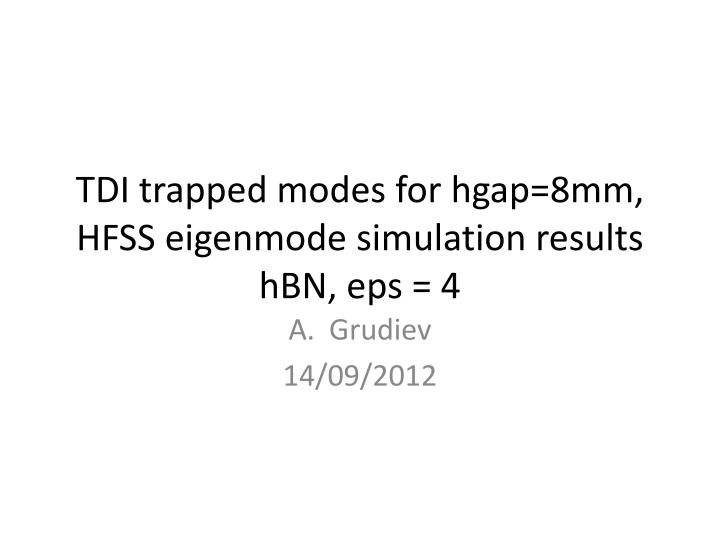
TDI trapped modes for hgap =8mm, HFSS eigenmode simulation results hBN , eps = 4. Grudiev 14/09/2012. Geometry of TDI in HFSS. Horizontal plane of symmetry is used. Half gap = 8 mm. R/Q estimate from PEC impedance calculated in CST. Reminder from classical P. Wilson, SLAC-PUB-4547.

E N D
TDI trapped modes for hgap=8mm, HFSS eigenmode simulation resultshBN, eps = 4 Grudiev 14/09/2012
Geometry of TDI in HFSS. Horizontal plane of symmetry is used Half gap = 8 mm
R/Q estimate from PEC impedance calculated in CST Reminder from classical P. Wilson, SLAC-PUB-4547 For impedance of N modes with Q >> f/df, where df=c/s_max, for PEC Q~∞
R/Q estimated from longitudinal impedance calculated in CST, hBN, b0, σz = 50 mm 4(Zl-Zl0)*df/πf is plotted where Zl0 = 71 Ohm to make the real part positive
R/Q estimated from longitudinal impedance, hBN, b0, σz = 100 mm, and HFSS eigenmode results 4(Zl-Zl0)*df/πf is plotted where Zl0 = 71 Ohm to make the real part positive
R/Q estimated from longitudinal impedance, hBN, b0, σz = 100 mmand HFSS eigenmode results 4(Zl-Zl0)*df/πf is plotted where Zl0 = 71 Ohm to make the real part positive
Table of longitudinal mode parameters calculated in HFSS, hBN, 4S60@500MHzaccelerator definition of R/Q: P=I2*R/Q*Q -? -? Power loss on the different surfaces normalized to the total power loss: P_vt - power loss on the vacuum tank walls P_bs – power loss on the beam screen surface P_fc1,2 – power loss on the surfaces of the flexible contacts 1 and 2, respectively
Low frequency mode at 31 MHzElectric field distribution in horizontal and vertical planes (log scale) All volume filled with EM fields Inside and outside of beam screen f = 31 MHz; Q = 164; RT = 80 Ohm; Plossfor Ib=0.36A: ~10W
Low frequency mode at 58.6MHzElectric field distribution in horizontal plane All volume filled with EM fields Inside and outside of beam screen f = 58.6 MHz; Q = 195; RT = 150 Ohm; Ploss for Ib=0.36A: ~19W power loss distribution: 50% -> Al keeper 43% -> Cu beam screen 2 x 2% -> Cu flexible contacts 2% -> SS jaw support 1% -> SS vacuum tank
High frequency mode at 1224 MHz Electric field distribution in horizontal plane Localized field distribution f = 1224 MHz; Q = 755; RT = 14 kOhm power loss distribution: 49% -> Al keeper 38% -> Cu beam screen 1.5% -> Cu flexible contact 4% -> SS jaw support 7.5% -> SS vacuum tank
R/Q estimated from longitudinal impedance, hBN, b0, σz = 100 mmand HFSS eigenmode results 4(Zl-Zl0)*df/πf is plotted where Zl0 = 71 Ohm to make the real part positive
hBN modesTable of longitudinal mode parameters calculated in HFSS, hBN, 4S60@500MHzaccelerator definition of R/Q: P=I2*R/Q*Q Coupling to beam 2 is zero since the field is between the hBN blocks
hBN mode, f=1.9675 GHz, Q=10299 Most of the field is in the hBN blocks R/Q [0,b1,b2] = [645, 518, 0] Ohm R [0,b1,b2] = [6.64, 5.33, 0] MOhm
Electric field distribution forhBN mode, f=1.9675 GHz, Q=10299
RF losses distribution for hBNmode, 1st order tetr.: f=1.9675 GHz, Q=10299/2nd order tetr.: f =1.9664 GHz, Q=9275 1st : Q=Wω/(Pv+Ps) =21.4e-16*2*3.14*1.97e9/(0.29e-9+2.77e-9) = 8652 2nd: Q=Wω/(Pv+Ps) = 5.9e-16*2*3.14*1.97e9/(0.12e-9+0.84e-9) = 7600
RF losses distribution for hBNmode, Keeper in Al: f=1.9675 GHz, Q=10299/Keeper in Cu: f =1.9675 GHz, Q=11309R/Q [Ω]: b0 = 518, b1 = 414, b2 = 0
Power loss for HL-LHC beams Gaussian bunch (GB): RMS sigma_z = 85mm RMS sigma_t = 0.284 ns Cos^2 bunch (CB): the same width at half hight as GB: HWHH_t = sqrt(2*ln(2))*sigma_t= 0.334 ns Total bunch length 4*HWHH_t = 1.336 ns ? Measurements on B1 by ThemisM and PhilippeB on fill # 2261
Power loss for HL-LHC beams50 ns / 25 ns • Power loss assuming that the mode frequency is a harmonic of the beam spectrum: P=(Mb*Nb*q*frev)2*R/Q*Q*S(f0) • Power Spectrum functions: • Gaussian bunch: • Cos^2 bunch: • Parameters used: • Mb - number of bunches: 1404 / 2808 • Nb - bunch population: 3.5e11 / 2.2e11 • Frev - revolution frequency: 11.246 kHz
Power loss for 50 and 25 ns HL-LHC beamsGaussian bunches: sigma_z = 85 mm
Power loss for 50 and 25 ns HL-LHC beamscos^2 bunch: total bunch 1.336 ns
Power loss for 50 and 25 ns HL-LHC beamsguassian bunch:sigam_z = 85mmandcos^2 bunch: total bunch 1.336 ns(b1 only, since b2 ~ 0)
A way to estimate shunt impedance for other gaps and boundary conditions w/o lengthy HFSS simulations
Comparison of the power estimate from CST and HFSS calculations Shunt impedance for other gaps and boundary conditions (BC) can be estimated using CST R/Q estimate calculated for specific gap and BC and assuming HFSS Q estimate calculated for gap=16mm is valid for other gaps and BC, then the power loss estimate can be done without long HFSS simulations