Download
1 / 1
10 likes | 94 Views
Spatial Clusters of Lyme Disease in New York State, From 2001 to 2006. Nathan T. Donnelly from SUNY Albany Ronei Marcos de Moraes, Ph.D., Cristina S.C. Holmes, M.S., & Wanessa W. da Luz Freita from Univers idade Federal da Paraiba. Introduction.

E N D
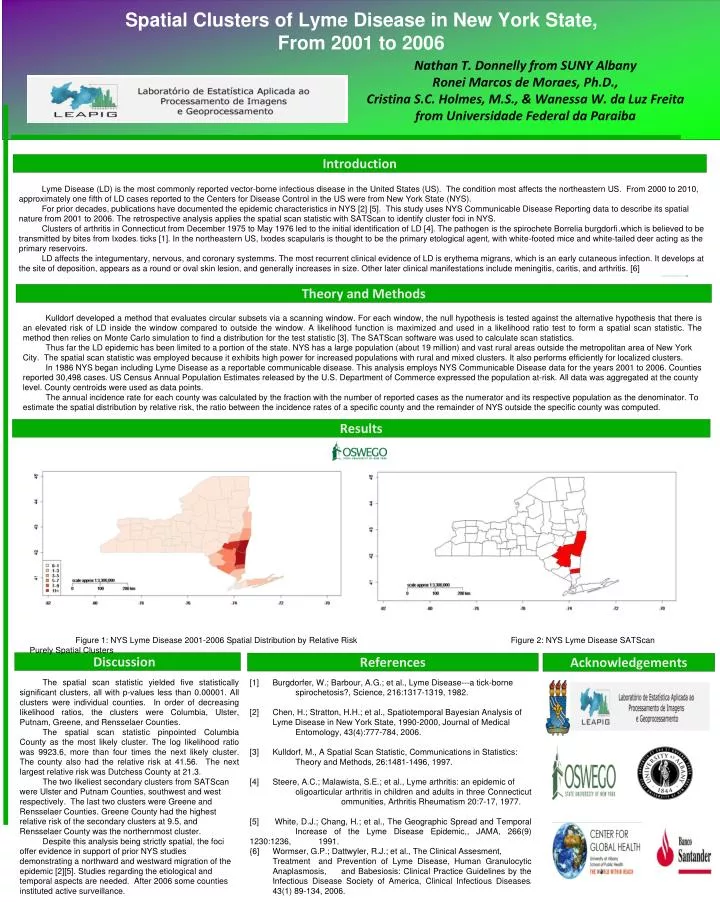
Spatial Clusters of Lyme Disease in New York State, From 2001 to 2006 Nathan T. Donnelly from SUNY Albany Ronei Marcos de Moraes, Ph.D., Cristina S.C. Holmes, M.S., & Wanessa W. da Luz Freita from Universidade Federal da Paraiba Introduction Lyme Disease (LD) is the most commonly reported vector-borne infectious disease in the United States (US). The condition most affects the northeastern US. From 2000 to 2010, approximately one fifth of LD cases reported to the Centers for Disease Control in the US were from New York State (NYS). For prior decades, publications have documented the epidemic characteristics in NYS [2] [5]. This study uses NYS Communicable Disease Reporting data to describe its spatial nature from 2001 to 2006. The retrospective analysis applies the spatial scan statistic with SATScan to identify cluster foci in NYS. Clusters of arthritis in Connecticut from December 1975 to May 1976 led to the initial identification of LD [4]. The pathogen is the spirochete Borrelia burgdorfi.which is believed to be transmitted by bites from Ixodess ticks [1]. In the northeastern US, Ixodes scapularis is thought to be the primary etological agent, with white-footed mice and white-tailed deer acting as the primary reservoirs. LD affects the integumentary, nervous, and coronary systemms. The most recurrent clinical evidence of LD is erythema migrans, which is an early cutaneous infection. It develops at the site of deposition, appears as a round or oval skin lesion, and generally increases in size. Other later clinical manifestations include meningitis, caritis, and arthritis. [6] Theory and Methods Kulldorf developed a method that evaluates circular subsets via a scanning window. For each window, the null hypothesis is tested against the alternative hypothesis that there is an elevated risk of LD inside the window compared to outside the window. A likelihood function is maximized and used in a likelihood ratio test to form a spatial scan statistic. The method then relies on Monte Carlo simulation to find a distribution for the test statistic [3]. The SATScan software was used to calculate scan statistics. Thus far the LD epidemic has been limited to a portion of the state. NYS has a large population (about 19 million) and vast rural areas outside the metropolitan area of New York City. The spatial scan statistic was employed because it exhibits high power for increased populations with rural and mixed clusters. It also performs efficiently for localized clusters. In 1986 NYS began including Lyme Disease as a reportable communicable disease. This analysis employs NYS Communicable Disease data for the years 2001 to 2006. Counties reported 30,498 cases. US Census Annual Population Estimates released by the U.S. Department of Commerce expressed the population at-risk. All data was aggregated at the county level. County centroids were used as data points. The annual incidence rate for each county was calculated by the fraction with the number of reported cases as the numerator and its respective population as the denominator. To estimate the spatial distribution by relative risk, the ratio between the incidence rates of a specific county and the remainder of NYS outside the specific county was computed. Results Figure 1: NYS Lyme Disease 2001-2006 Spatial Distribution by Relative Risk Figure 2: NYS Lyme Disease SATScan Purely Spatial Clusters Discussion References Acknowledgements The spatial scan statistic yielded five statistically significant clusters, all with p-values less than 0.00001. All clusters were individual counties. In order of decreasing likelihood ratios, the clusters were Columbia, Ulster, Putnam, Greene, and Rensselaer Counties. The spatial scan statistic pinpointed Columbia County as the most likely cluster. The log likelihood ratio was 9923.6, more than four times the next likely cluster. The county also had the relative risk at 41.56. The next largest relative risk was Dutchess County at 21.3. The two likeliest secondary clusters from SATScan were Ulster and Putnam Counties, southwest and west respectively. The last two clusters were Greene and Rensselaer Counties. Greene County had the highest relative risk of the secondary clusters at 9.5, and Rensselaer County was the northernmost cluster. Despite this analysis being strictly spatial, the foci offer evidence in support of prior NYS studies demonstrating a northward and westward migration of the epidemic [2][5]. Studies regarding the etiological and temporal aspects are needed. After 2006 some counties instituted active surveillance. [1] Burgdorfer, W.; Barbour, A.G.; et al., Lyme Disease---a tick-borne spirochetosis?, Science, 216:1317-1319, 1982. [2] Chen, H.; Stratton, H.H.; et al., Spatiotemporal Bayesian Analysis of Lyme Disease in New York State, 1990-2000, Journal of Medical Entomology, 43(4):777-784, 2006. [3] Kulldorf, M., A Spatial Scan Statistic, Communications in Statistics: Theory and Methods, 26:1481-1496, 1997. [4] Steere, A.C.; Malawista, S.E.; et al., Lyme arthritis: an epidemic of oligoarticular arthritis in children and adults in three Connecticut ommunities, Arthritis Rheumatism 20:7-17, 1977. [5] White, D.J.; Chang, H.; et al., The Geographic Spread and Temporal Increase of the Lyme Disease Epidemic,, JAMA, 266(9) 1230:1236, 1991. {6] Wormser, G.P.; Dattwyler, R.J.; et al., The Clinical Assesment, Treatment and Prevention of Lyme Disease, Human Granulocytic Anaplasmosis, andBabesiosis: Clinical Practice Guidelines by the Infectious Disease Society of America, Clinical Infectious Diseasess 43(1) 89-134, 2006.