Download
1 / 18
200 likes | 344 Views
Football Data. Example for Chapter 2. During Spring Term 2012, data were collected from 32 random HC football players. Which of these variables do you think are strongly associated? Which of these variables have a weak association or maybe no association?

E N D
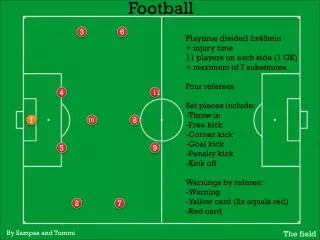
Football Data Example for Chapter 2
During Spring Term 2012, data were collected from 32 random HC football players.
Which of these variables do you think are strongly associated? • Which of these variables have a weak association or maybe no association? • How do we graph two quantitative variables together? • How do we measure the strength and direction of a linear association?
The five highest correlations are: • 0.781 (max bench press & weight) • 0.764 (40-yard dash time & weight) • 0.477 (40-yard dash time & max bench press) • 0.460 (max squat & max bench press) • 0.456 (height & weight) • Explain why it makes sense that all of these are positive.
The five lowest correlations are: • 0.083 (max squat & 40-yard dash) • 0.134 (max squat & height) • 0.319 (40-yard dash & height) • 0.329 (max bench press & height) • 0.329 (max squat & weight)
Is it reasonable to predict a player’s 40-yard dash time from his max squat?
To predict 40-yard dash time (seconds) from a football player’s weight, the linear model is • If Sam weighs 50 pounds more than Jose, use the regression equation to predict how much faster Jose will be in running the 40-yard dash. • Does it make sense to try to interpret the value of the y-intercept (3.74) in this context? • Use the regression equation to estimate the 40-yard dash time for a random football player who weighs 200 pounds. • Explain why it’s unreasonable to estimate the 40-yard dash time for a random football player who weighs 360 pounds. (What is this called?)
It is not possible to accurately predict a player’s height from his weight. The association is weak.
Use the regression equation to predict max bench press for a random football player who weighs 265 pounds.
Since the outliers are far from the line, they weaken the correlation. 2 possible outliers
After excluding the outliers, the square of the correlation has increased from 0.212 (weak) to 0.533 (moderate).