Download
1 / 20
200 likes | 324 Views
Estimating the North American Carbon Balance Using Inter-Comparison Among Inversions, Regional Terrestrial Biogeochemistry Models, and Observational Data.

E N D
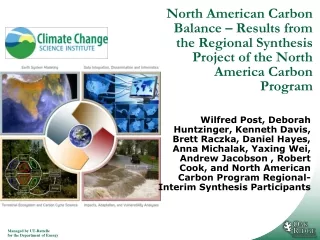
Estimating the North American Carbon Balance Using Inter-Comparison Among Inversions, Regional Terrestrial Biogeochemistry Models, and Observational Data Wilfred Post, Deborah Huntzinger, Kenneth Davis, Brett Raczka, Daniel Hayes, Anna Michalak, Yaxing Wei, Andrew Jacobson , Robert Cook, and North American Carbon Program Regional-Interim Synthesis Participants
North America Carbon Program Synthesis Objectives • Utilize new and emerging NACP research findings to develop a picture of the current state of the North America carbon cycle • Identify continental scale carbon sources/sinks • Characterize continental scale inter-annual variation • Assess our capability of modeling and measuring large scale carbon cycle dynamics Presentation_name
Data sets assembled and regridded for comparison with models • MODIS monthly GPP, annual NPP • Soil C from surveys • Inventory based C pool and flux estimates • Forest biomass from inventory • Crop NPP from crop yield data • Comparison with eddy flux – crossover model runs with Site Synthesis Presentation_name
Participating Models • 19 TBMs • Models differ in: • Prognostic versus diagnostic • Driver data • Vegetation and soil properties • Photosynthetic formulation • # of carbon pools, soil carbon decomposition dynamics • Processes included, etc. • 25 Inverse Models • 20 models with TRANSCOM results • 8 models with post-TRANSCOM results resolved to 1x1 degree Presentation_name
TBM Model Net Flux for North America Across model mean net flux; 2000-2005 • NEP = 0.66 PgC/yr(1.8 to -0.25 PgC/yr) • NPP = 9.2 PgC/yr(6.2 to 13.8 Pg C/yr) • GPP = 18.4 PgC/yr(9.9 to 31.7 Pg C/yr) • Rh = 8.6 PgC/yr(5.8 to 13.1 Pg C/yr) Presentation_name
Long-term Mean Summer (June, July, August) Net Ecosystem Productivity Presentation_name
Can we diagnose the reasons for the lack of consensus in TBM performance? • Driver data • Photosynthesis formulation • Phenology • Decomposition – N limitation • Regional differences • Missing important processes Presentation_name
Crossover Models - Regional model runs are more positively biased for GPP. Site model runs closer to observations. Raczka et al. (in preparation)
Long-Term Mean NEE – TBMs and Inversions Presentation_name
Net NPP over U.S. Agricultural Lands:Models Compared to NASS Inventory-Based Data Presentation_name
Net NPP Spatial Pattern Over U.S. Agricultural Lands: Models Compared to NASS Inventory-Based Data Presentation_name
Inventory – Model Comparison Presentation_name
Forest / Cropland Sector “Other” Lands Sector Accounting for Lateral Fluxes NEE NEE CH4 CH4 CO2 CO2 RH NPP Fire Fire DLivestockC DHumanC Consumption Harvest DVEGC DPRODC CO2 Release CO2 Uptake Residue Grasslands / Settlements DSOILC Imports – Exports Export Land Use Change Presentation_name
TOTAL FORESTLAND CROPLAND OTHER LANDS INVENTORY DATA FORWARD MODELS INVERSE MODELS Mean average annual NEE (Tg C yr-1), 2000 to 2006
Summary • Regional TBM comparisons indicate a lack of consensus for NEP and component fluxes – GPP, Ra, Rh • Analyses to diagnose the causes reveal: • Model formulation plays a significant role. • Different weather driver data sets greatly impact GPP • TBM Re tends to be tightly related to GPP – this dampens the NEE seasonal cycle and IAV • Annual NEE cycle amplitude is small for TBM compared to inversions. Presentation_name
Conclusions • Regional C modeling enterprise needs a more rigorous approach to development and evaluation. • Large disparities remain in estimates based on temporal and spatial extrapolations of experimental and site based understanding. • Additional data, especially based on spatially extensive measurements, needs to be integrated into the modeling system approach. • Improve model algorithms/parameters • Improved diagnostic and predictive usefulness • Evaluate model skill • Develop useful benchmarks • An transition from data-poor to data-rich approach is emerging for developing multi-stream observing systems and modeling system analyses. • The NACP regional synthesis has contributed by exploring how a wider range of data sources can be used. Presentation_name
Next Steps • RECCAP • If you have model results for 1990-2008 we would be interested in incorporating them into the North American RECCAP chapter. • Contact Mac Post <postwmiii@ornl.gov> • MsTMIP • If you didn’t make it to the Side Meeting yesterday you are still invited to participate • Contact Deborah Huntzinger <dnhuntzi@umich.edu> • Check the NACP web site for a MsTMIP e-mail list to be started soon. Presentation_name
Acknowledgments • NASA Terrestrial Ecology support the Modeling and Synthesis Thematic Data Center (MAST-DC) • DOE Office of Science for workshop support • NOAA support for collecting inversion model results • Generous contributions of time and resources from any modeling teams and data providers that made these analyses possible Presentation_name