Download
1 / 23
230 likes | 505 Views
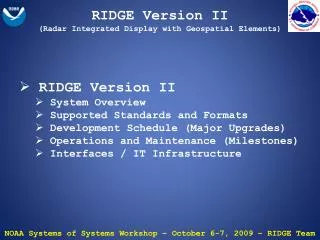
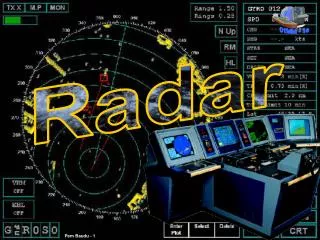
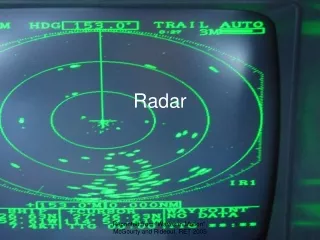
Innovation Radar Display Heleen ter Pelkwijk. EGOWS 2008 Application made by: Ernst de Vreede Rijk Oosterhoff Floris Ouwendijk Project Leader: Joop Konings. This presentation. The reason for this project The user groups The system plan The result. The “old” radar display.

E N D
Innovation Radar DisplayHeleen ter Pelkwijk EGOWS 2008 Application made by: Ernst de Vreede Rijk Oosterhoff Floris Ouwendijk Project Leader: Joop Konings
This presentation • The reason for this project • The user groups • The system plan • The result
The reason for the project (1) • New radar hardware and software • The “old” BRAS application is top-heavy • Many different versions of radar display systems • Scalable Vector Graphics (SVG) works only on PC platforms in MSIE • No development on SVG plug-inn we use • Extra functionalities are needed: - Graphic improvements - Geographic information
Not in MWS • The forecasters use the radar display as a wall clock
The user groups (1) • Forecasters and intranet users KNMI Important is: * stability * quick in use * easy to use * extensive set of maps * quick delivery of data.
The user groups (2) • Extranet users (password) - water management - disaster management - aviation - employees of the ministry Important is: * limited communication volumes * easy to use * little configuration for user * little dependence of browser and operating systems
OMBE Import VIVID Metadata png evt.xml D I S C DB Metadata Schoning KODAC webserver data - radar service config usr beheer GIS materiaal appl requests requests HTTP meta-info NTTP (JWS) data data Client The system plan Data input Server part Client part
The result • A JAVA application
The result (different maps) • Different map options:
The result (geographical options) • Different geographical options:
The result (products) • Products we show in the application: - radar reflection - echotop height - lightning - radar forecast - European radar - synops - derivated products like: * risk for summerhail
The result (users) • Easy scroll and pan options • More players • Control buttons • Warnings buttons • Overlays with different data types
The result (archive) • An archive function
The result (control) • Control buttons for separate windows • Save and print options • Show legend • Info panel
The result (info panel) • The info panel
The result (drawing) • Drawing functionalities • Distance measurement function
The result (marker) • Marker options - Search • Coordinate • Mouse click
The result (configuration) • Create and load a personal configuration
The result (preferences) • Change your preferences • Used units • Used warnings
The result • Try it yourself during the demo!
Questions? • Thank you for your attention! For technical questions: • Developer: vreedede@knmi.nl • Project leader: konings@knmi.nl • My email: pelkwijk@knmi.nl