Download

1 / 53
530 likes | 669 Views
CHAPTER 3: The BIOSPHERE. 3-1 What is Ecology? 3-2 Energy Flow 3-3 Cycles of Matter. Ecology. Study of the interactions of organisms with one another and with their physical surroundings. Earth is a Living Planet. Earth is a single living system.

E N D
CHAPTER 3: The BIOSPHERE 3-1 What is Ecology? 3-2 Energy Flow 3-3 Cycles of Matter
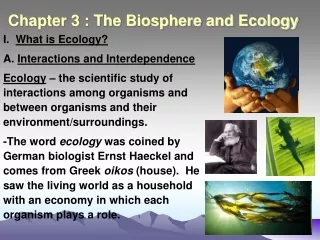
Ecology Study of the interactions of organisms with one another and with their physical surroundings.
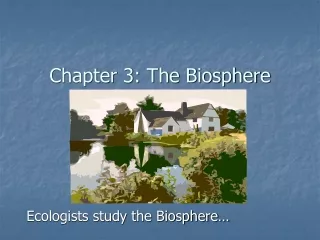
Earth is a Living Planet Earth is a single living system. It is a biosphere. The biosphere is that part of the Earth in which life exists.
A view of Earth from space A Central Park woodland Approaching Central Park (the red rectangle in the middle of this photo) An eastern gray squirrel Figure 1.2.1
A Hierarchy of Interactions Organismal ecology (individual) Population ecology (group of individuals) Community ecology (all organisms in a particular area) Ecosystem ecology (all organisms and abiotic factors)
Ecosystems An ecosystem consists of a given area’s (______________) and (______________). physical features abiotic factors living organisms biotic factors
Abiotic factors nonliving physical parts of an ecosystem such as _______________ type, rocks, temperature, _______________, and rainfall. water, sunlight, soil humidity, elevation Wind: Can affect the pattern of a plant’s growth
Biotic Factors living aspects of an ecosystem such as_____________ _______________, worms, amoebas, and waterlilies. fishes, frogs, insects, snails,
Habitats Ecosystems containHabitats, and the location or surrounding where the organism lives
Niches, the behavior of organisms in their habitats.
Community organisms living together in an ecosystem
3-2 Energy Flow A. The Flow of Energy 1. All energy used by living organisms __________________________ 2. Use only ______ of the total energy _________________ originate from the sun. 0.1% given by the sun.
SUNPLANTSHerbivoresCarnivores 100%50% used immediatelyor by the plants; rest is Omnivores stored within roots as starch CONSUMERS PRODUCERS
4. Energy is _____________________ ______________________ 5. The raw materials can be recycled: _______________________ lost with each transfer and can’t be recycled! atoms/molecules
B. ECOSYSTEM STRUCTURE 1. abiotic factors – ____________________ examples: __________________________ nonliving components water, light, heat, gases, minerals 2. Biotic factors – organisms transfer energy, participate in cycle of chemicals, change environment
Sunlight Ecosystem The dynamics of any ecosystem depends on two processes: Heat 1. Cycling of nutrients 2. Flow of energy Consumers (such as animals) Heat Producers (plants and other photosynthetic organisms) Chemical energy (food) Figure 1.3
SUMMARY OF KEY CONCEPTS An Overview of Ecosystem Dynamics Heat Light Ecosystem Energy flow Producers Consumers Decomposers Chemical cycling (biotic abiotic) Visual Summary 19.1
a. autotrophic (self-feeding; producers) plants are photosynthetic b. heterotrophic (feeding on others; consumers) 1. Herbivores = ___________________ 2. Carnivores = ___________________ 3. Carnivores = ___________________ primary consumers secondary consumers tertiary consumers c. decomposers – or break down organic material into the same abiotic materials that we started with. Yes, nature is the championrecycler! mainly microscopic fungi and bacteria that metabolize
Derive their energy from the dead material left by all trophic levels • Are often left off of most food chain diagrams Detritivores, or decomposers Figure 19.22
All energy used by living organisms: Sunlight energy Ecosystem originate from the sun Photosynthesis (in chloroplasts) Carbon dioxide Glucose Oxygen Water Cellular respiration (in mitochondria) for cellular work Heat energy
Energy flows through an ecosystem in one direction, beginning with solar energy. This stored energy then passes through a food chain, a series of organisms that successively eat one another. The trophic level, or feeding level, of an organism is the number of food chain links between it and the ecosystem’s energy source.
C. Feeding Relationships 1.Food chain: a. chains are found in harsh climates like the desert and tundra . b.Desert or tundra areas are than those found in more moderate climatic influences e.g. follow the progression of energy flow from one organism to another or “who eats whom.” shorter food less stable and more easily destroyed tropical rain forests.
food chains interconnect 2.Food webs: , forming complex food webs. a.webs form when one species eats or is eaten by several other species and when one species functions at more than one trophic level. b.Example: a person eating a tuna sandwich is both a (a herbivore, eating bread) and a (a carnivore eating another carnivore, the tuna). primary consumer tertiary consumer
Autotrophs Heterotrophs Trophic Levels and Food Chains Producer Carnivore (secondary consumer) Herbivore (primary consumer) Light Energy and chemicals Detritus Detritivore (decomposer) Organic and inorganic compounds Visual Summary 19.2
LEVEL NAME KIND OF ORGANISM TYPES OF FEEDING ENERGY SOURCE 1st trophic Primary producer Plants Autotroph Sun 2nd trophic Primary consumer Herbivores Heterotroph Plants 3rd trophic Secondary consumer Carnivore Heterotroph Herbivores 4th trophic Tertiary consumer Top carnivore Heterotroph Carnivores 5th trophic decomposer Detritivore Heterotroph All other organisms
Trophic Levels and Food Chains Quaternary consumers A food chain: Carnivore • Is the sequence of food transfer from trophic level to trophic level • May have many levels Carnivore Tertiary consumers Carnivore Carnivore Secondary consumers Carnivore Carnivore Primary consumers Zooplankton Herbivore Producers Plant Phytoplankton Figure 19.21 A marine food chain A terrestrial food chain
D. Ecological Pyramids 1. 2.way of visually demonstrating a food chain 3.shape of the pyramid shows 4.Note that of all the grasses and cereal grains fed cattle are used and lost by a cow Only 10% is actually used in manufacturing muscle tissue (beef steaks). shows energy relationships among each trophic level that the transfer of energy from one level to the next is not that efficient 90% as body heat, wastes and to provide the energy for a cow to survive.
5. The base level of a biotic pyramid contains plant life; the greatest number of individuals; the greatest amount of potential food energy; and, the greatest amount of biomass (weight). Approximately 90% loss of energy at each trophic level Energy
Ecological Pyramids Energy Pyramid Shows the relative amount of energy available at each trophic level. Organisms use about 10 percent of this energy for life processes. The rest is lost as heat. Pyramid of Numbers Shows the relative number of individual organisms at each trophic level. Biomass Pyramid Represents the amount of living organic matter at each trophic level. Typically, the greatest biomass is at the base of the pyramid.
6. Relative to the human diet, it is more ______ to eat than to eat the cows that ate the plant material. Some 90% of all the grain produced in this country is fed to livestock. efficient plant materials
Eating producers instead of consumers requires less photosynthetic productivity and reduces the impact on the environment Human meat-eaters Secondary consumers Primary consumers Human vegetarians Cattle Corn Corn Producers (a) (b) Figure 19.27
Biomagnification (DDT,PCB,Metals) Food Chain Efficiency Cod, Tuna, Marine Mammals 5 PPM 0.20 BT 10% .5 PPM 2 BT Squid, Sardines, Anchovies, Herring 10% Zooplankton, Copepods, Krill 20 BT .04 PPM 10% 200 BT . .003 PPM Phytoplankton, Diatoms, Cyanobacteria .00003 PPM
3-3 Cycles of Matter A. Biogeochemical Cycles: 1. Water cycle a. driven by (2) processes: b. water enters the atmosphere by of plants as well as c. = forms H20 into rain clouds d. = release of H20 from clouds to surface evaporation and condensation transpiration evaporation. condensation precipitation
Net movement of water vapor by wind (36) Solar heat Water vapor over the land Water vapor over the sea The Water Cycle Precipitation over the land (95) Evaporation and transpiration (59) Precipitation over the sea (283) Evaporation from the sea (319) Surface water and groundwater Flow of water from land to sea (36) Oceans (d) The water cycle Figure 19.29d
2. Nitrogen cycle a. sources = atmosphere (gas) = b. found in c. Nitrogen fixation: takes nitrogen from atmosphere and converts nitrogen into a useful form. Process: N2 nitrites (NO2-) and nitrates (NO3-) 78% of atmosphere waste products, dead and decaying organisms Nitrifying bacteria causes this to occur which can be found on roots of plants called legumes (examples of legumes: peanuts, beans, peas)
d. Denitrification: denitrifying bacteria in soil break down these nitrogen compounds from that have been decomposed. dead plants and animals free nitrogen Through this process, is returned to the atmosphere
Nitrogen (N2) in atmosphere The Nitrogen Cycle Detritus Amino acids and proteins in plants and animals Detritivores Denitrifying bacteria Assimilation by plants Nitrogen-fixing bacteria in root nodules of legumes Decomposition Nitrates (NO3– ) Nitrogen fixation Nitrogen-fixing bacteria in soil Ammonium (NH4+ ) Nitrifying bacteria (b) The nitrogen cycle Figure 19.29b
3. Carbon and oxygen cycles a. CO2 makes up only of gases in atmosphere, .035% but plays a crucial role in supporting biotic component. • photosynthesis takes in CO2, animals gain carbon by consuming photosynthesizers; carbon stored in living systems collectively makes up; biomass respiration and action of decomposers releases CO2 back into abiotic part of ecosystem.
c. Flow of carbon (and food) in ecosystem: decomposers Atmospheric CO2 plants animals Atmospheric CO2 d. Oxygen cycle: Photosynthesis: H20 is split, Respiration: H20 is released releasing oxygen. and then absorbed by plants
CO2 in atmosphere Photosynthesis Burning The Carbon Cycle Producers Wood and fossil fuels Cellular respiration Higher-level consumers Primary consumers Decomposition Detritivores Detritus (a) The carbon cycle Figure 19.29a
Oxygen Cycle Vein Chloroplast Meso- phyll Inner membrane Outer membrane Stomata Leaf cross section Mesophyll cell Grana Stroma Thylakoid Thylakoid space Photosynthesis: H20 is split releasing oxygen Figure 7.3
Respiration: H20 is released and then absorbed by plants
B. Nutrient Limitation 1.Law of the minimum/limiting factor – 2.What is the limiting factor in the desert? 3.What is the limiting factor in the tropics? where one abiotic factor is deficient enough to be ecologically limiting, thereby exerting a powerful influence on the entire ecosystem H20 Minerals in the soil
Quaternary, tertiary, and secondary consumers Tertiary and secondary consumers Secondary and primary consumers Primary consumers Producers (plants) Figure 19.23
SUMMARY OF KEY CONCEPTS Chemical Cycling Between Photosynthesis and Cellular Respiration Heat Sunlight Cellular respiration Photosynthesis Visual Summary 6.1