Download
1 / 27
270 likes | 279 Views
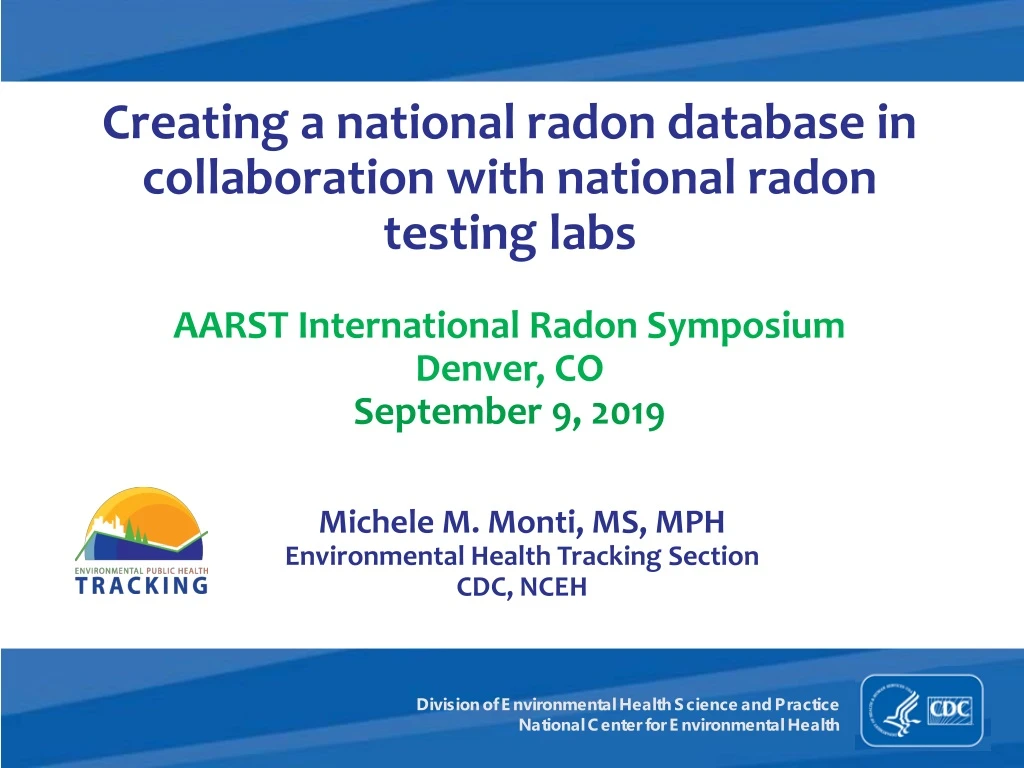
Creating a national radon database in collaboration with national radon testing labs AARST International Radon Symposium Denver, CO September 9, 2019. Michele M. Monti, MS, MPH Environmental Health Tracking Section CDC, NCEH. Division of Environmental Health Science and Practice

E N D
Creating a national radon database in collaboration with national radon testing labsAARST International Radon Symposium Denver, CO September 9, 2019 Michele M. Monti, MS, MPH Environmental Health Tracking Section CDC, NCEH Division of Environmental Health Science and Practice National Center for Environmental Health
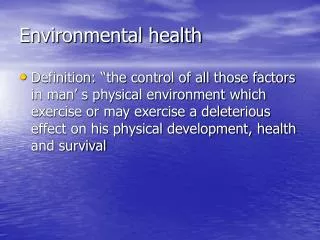
Environmental Public Health Tracking nationwide health tracking network to highlight relationships between chronic diseases and the environment Pew Environmental Health Commission Report Division of Environmental Health Science and Practice National Center for Environmental Health
Radon Background • Leading cause of lung cancer after smoking • 21,000 lung cancer deaths per year • Radon is found everywhere, generated from the radioactive decay of uranium • Healthy People 2020 • National Radon Action Plan www.epa.gov/radon/pubs/citguide.html Division of Environmental Health Science and Practice National Center for Environmental Health
Radon and Tracking Program • Radon Task Force 2011 - 2012 • Radon White Paper • EPA State Radon Data Exchange • Radon Pilot Phase 1 – 2013 - 2014 • Radon Pilot Phase 2 – 2015 - 2016 • Radon Work Group – 2016 – present • CDC/Private lab collaboration – 2018 - present • Division of Environmental Health Science and Practice • National Center for Environmental Health
Radon data submitted by labs 6 labs currently participating: • Accustar • AirChek • Alpha Energy Labs • EMSL • RAL • Radalink* * no data yet • Division of Environmental Health Science and Practice • National Center for Environmental Health
Radon data submitted by labs Current dataset (5 labs): • # records: 2,288,529 • # years: 2000 to 2018; usable 2005 to 2017 • # states: 48 (-NJ; KS); # usable states: 46 (-HI; -MS) • Division of Environmental Health Science and Practice • National Center for Environmental Health
Radon indicators and measures • Separate indicator and measures from labs and state submitted data • Two Indicators: • Radon Tests from Labs • Radon Tests from States • Division of Environmental Health Science and Practice • National Center for Environmental Health
Radon measures - Labs 1. Number of buildings tested, by year 2. Number of buildings tested, (10 yr periods from 2005-2017) 3. Maximum radon level in tested buildings (pre-mitigation, 10 yr periods, 3 levels (<2; 2 to <4; >4) this is your stoplight map!! 4. Median radon level in tested buildings, pre-mitigation, 10 yr periods, 3 levels (<2; 2 to <4; >4) this is your stoplight map!! 5-6. Number/Percent of pre-mitigation tests by radon levels, 10 yr periods from 2005-2017 7-8. Number/Percent of post-mitigation tests by radon levels, 10 yr periods from 2005-2017 • Division of Environmental Health Science and Practice • National Center for Environmental Health
https://ephtracking.cdc.gov/ https://www.cdc.gov/nceh/tracking/
Download of a map Downloading a map
New Developments • Radalink has signed a data sharing agreement with CDC • A revised Data Dictionary with more detail requested by Radalink is available for use by other labs • Texas A&M has partnered with CDC to geocode data; this service is available for labs interested in sending data directly to CDC
Future efforts • Census tract level data; additional data required to be able to display at this level • Greater coverage of U.S. with greater participation (e.g., TX, HI, & MI)
Thank you! Michele M. Monti mmonti@cdc.gov https://www.cdc.gov/nceh/tracking/ The findings and conclusions in this presentation have not been formally disseminated by the Centers for Disease Control and Prevention/the Agency for Toxic Substances and Disease Registry and should not be construed to represent any agency determination or policy. Division of Environmental Health Science and Practice National Center for Environmental Health