Download

1 / 13
130 likes | 136 Views
Layout Optimisation Brings Step Change in Wind Farm Yield. Dr Andrej Horvat, Intelligent Fluid Solutions Dr Althea de Souza, dezineforce. Come and visit us on Stand V16 Boyd Orr Hall. Acknowledgment. Present work is a joint effort of David Hartwanger - Intelligent Fluid Solutions

E N D
Layout Optimisation Brings Step Change in Wind Farm Yield Dr Andrej Horvat, Intelligent Fluid Solutions Dr Althea de Souza, dezineforce Come and visit us on Stand V16 Boyd Orr Hall
Acknowledgment Present work is a joint effort of • David Hartwanger - Intelligent Fluid Solutions • Richard Harding - dezineforce • Althea de Souza1 - dezineforce • Andrej Horvat2 - Intelligent Fluid Solutions 2Dr. Andrej Horvat Principal Engineer Intelligent Fluid Solutions Ltd. andrej.horvat@intelligentfluidsolutions.co.uk www.intelligentfluidsolutions.co.uk 1Dr. Althea de Souza Senior Design Engineer dezineforce althea.desouza@dezineforce.com www.dezineforce.com
Presentation Structure • Motivation and problem definition • Wind turbine modelling methodologies • Wind farm simulation • Maximizing investment yield • Optimisation of the wind farm layout • Conclusions & further work
Motivation and problem definition • Significant demand for renewable sources of energy, where wind power is (one of) the largest contributors • Power output from a wind farm depends on wind availability (intermittency in strength and wind direction), local topology and turbine quantity • Installation of wind farms is capital intensive • In such an environment, accurate prediction of wind farm power output is crucial for planning installation capacity and to maximise return on the investment • Interaction between turbine wakes means turbine layout affects total power output
Wind turbine modelling methodologies • Detailed simulations (CFD) of entire wind farms are computationally demanding • Individual turbines can be modelled using blade element theory to reduce overall computational requirements • Effects of a rotating turbine on the flow are modelled with momentum sources/sinks • Correct time-averaged representation of axial and tangential wake velocities
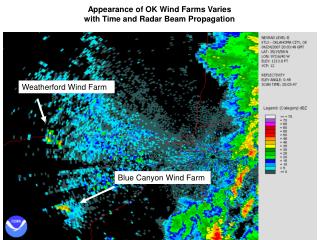
Wind farm simulation • Turbines are arranged in staggered (zig-zag) pattern to minimise wake influence • Covering fixed surface area of 2 x 3 km in streamwise (x) and spanwise (y) direction • Steady-state simulations were performed for different number of wind turbines in x and y direction ny 9 8 7 6 5 4 3 2 1 1 2 3 4 5 6 7 nx wind direction
Maximising Investment Yield • Reduction of flow velocity in the wake reduces the power output of each subsequent row of turbines • Which wind farm arrangement provides maximum power generation for a given investment?
Maximising Investment Yield • To find maximum power output for given investment costs • Computational Fluid Dynamics (CFD) calculations of the different wind farm arrangements were performed and total power calculated as a sum of power output from each turbine • the investment costs were divided into fixed costs (construction, grid connection, development etc.) and variable costs (proportional to the number of installed turbines) In this case study - 2MW Vestas V80 turbine was used as a representative example of a modern commercial turbine - single wind velocity of 15 m/s and single rotation speed of 16.7 rpm were considered - 28 mil EUR of fixed investment costs and 2.5 mil EUR per unit were assumed - The costs were estimated based on review studies prepared by Dept. of Trade and Industry (2001) and KEMA Nederland (2007)
Optimisation of the Wind Farm Layout • A CFD based modelling methodology was developed to predict wind farm power output for a given investment • For a set area and staggered layout, the number of turbines in each row (ny) and the number of rows (nx) were varied • Advanced design search and optimisation techniques were used to search for an optimal wind farm configuration • This approach cost effectively assessed the range of design options available • Additional variables can be considered, e.g. wind speed, direction, geographical site etc. nx ny
Optimisation of the Wind Farm Layout Based on a statistically significant but relatively small number of simulations (~30) the entire design space (~120 designs) is characterised 13 in first row, 5 rows = 63 turbines Power/Cost metric = 0.55 W/€ 13 in first row, 2 rows = 25 turbines Power/Cost metric = ~0.44 W/€ 13 in first row, 8 rows = 100 turbines Power/Cost metric = 0.39 W/€ 11 in first row, 6 rows = 63 turbines Power/Cost metric = ~0.51 W/€ 9 in first row, 8 rows = 68 turbines Power/Cost metric = ~0.31 W/€
Conclusions & Further Work • Blade element model was implemented in a commercial CFD package to simulate operation of wind turbines in a wind farm environment • Different wind farm layouts were simulated to calculate power output of the wind farm • The analysis shows that the same number of turbines in different layouts can result in significantly different yield • With alternate offset rows, wide, shallow wind farms are most profitable • The use of computational simulation methods and advanced optimisation tools can result in significant performance improvements
Conclusions & Further Work Further work • Different wind angles and speeds for full wind rose • Alternative staggering • Assessment of specific geographical topologies • Allowance for local geographical features • More complex investment models
Questions ? Stand V16 Boyd Orr Hall ...provides a unique, end-to-end service integrating computational engineering and optimisation tools, on demand over the web ...technologies have been developed over more than 10 years by world-renowned professors from the University of Southampton