Download
1 / 75
750 likes | 763 Views
Chapter 2: Modeling with Linear Programming & sensitivity analysis. Mute ur call. LINEAR PROGRAMMING (LP). -In mathematics, linear programming (LP) is a technique for optimization of a linear objective function, subject to linear equality and linear inequality constraints.

E N D
Chapter 2: Modeling with Linear Programming & sensitivity analysis
LINEAR PROGRAMMING (LP) -In mathematics, linear programming(LP) is a technique for optimization of a linear objective function, subject to linear equality and linear inequality constraints. -Linear programming determines the way to achieve the best outcome (such as maximum profit or lowest cost) in a given mathematical model and given some list of requirements represented as linear equations.
Mathematical formulation of Linear Programming model: Step 1 - Study the given situation - Find the key decision to be made • Identify the decision variables of the problem Step 2 • Formulate the objective function to be optimized Step 3 • Formulate the constraints of the problem Step 4 - Add non-negativity restrictions or constraints The objective function , the set of constraints and the non-negativity restrictions together form an LP model.
TWO-VARIABLE LP MODEL EXAMPLE: “ THE GALAXY INDUSTRY PRODUCTION” • Galaxy manufactures two toy models: • Space Ray. • Zapper. • Resources are limited to • 1200 pounds of special plastic. • 40 hours of production time per week.
Marketing requirement • Total production cannot exceed 800 dozens. • Number of dozens of Space Rays cannot exceed number of dozens of Zappers by more than 450. • Technological input • Space Rays requires 2 pounds of plastic and 3 minutes of labor per dozen. • Zappers requires 1 pound of plastic and 4 minutes of labor per dozen.
Current production plan calls for: • Producing as much as possible of the more profitable product, Space Ray ($8 profit per dozen). • Use resources left over to produce Zappers ($5 profit per dozen). • The current production plan consists of: Space Rays = 550 dozens Zapper = 100 dozens Profit = 4900 dollars per week
A Linear Programming Model can provide an intelligent solution to this problem
SOLUTION • Decisions variables: • X1 = Production level of Space Rays (in dozens per week). • X2 = Production level of Zappers (in dozens per week). • Objective Function: • Weekly profit, to be maximized
The Linear Programming Model Max 8X1 + 5X2 (Weekly profit) subject to 2X1 + 1X2 < = 1200 (Plastic) 3X1 + 4X2 < = 2400 (Production Time) X1 + X2 < = 800 (Total production) X1 - X2 < = 450 (Mix) Xj> = 0, j = 1,2 (Nonnegativity)
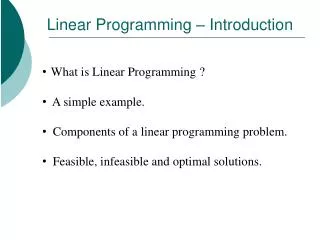
Feasible Solutions for Linear Programs • The set of all points that satisfy all the constraints of the model is called FEASIBLE REGION
Using a graphical presentation we can represent all the constraints, the objective function, and the three types of feasible points.
The plastic constraint: 2X1+X2<=1200 The Plastic constraint Productionmix constraint: X1-X2<=450 X2 1200 Total production constraint: X1+X2<=800 Infeasible 600 Feasible Production Time 3X1+4X2<=2400 X1 600 800
Profit = $ 000 Recall the feasible Region We now demonstrate the search for an optimal solution Start at some arbitrary profit, say profit = $2,000... Then increase the profit, if possible... X2 1200 ...and continue until it becomes infeasible Profit =$5040 4, 2, 3, 800 600 X1 400 600 800
X2 1200 Let’s take a closer look at the optimal point 800 Infeasible 600 Feasible region Feasible region X1 400 600 800
The plastic constraint: 2X1+X2<=1200 The Plastic constraint Productionmix constraint: X1-X2<=450 X2 1200 Total production constraint: X1+X2<=800 Infeasible A (0,600) 600 Feasible Production Time 3X1+4X2<=2400 B (480,240) C (550,100) E (0,0) D (450,0) X1 600 800
To determine the value for X1 and X2 at the optimal point, the two equations of the binding constraint must be solved.
Productionmix constraint: X1-X2<=450 The plastic constraint: 2X1+X2<=1200 2X1+X2=1200 3X1+4X2=2400 X1= 480 X2= 240 Production Time 3X1+4X2<=2400 2X1+X2=1200 X1-X2=450 X1= 550 X2= 100
By Compensation on : Max 8X1 + 5X2 The maximum profit (5040) will be by producing: Space Rays = 480 dozens, Zappers = 240 dozens
Type of feasible points • Interior point: satisfies all constraint but non with equality. • Boundary points: satisfies all constraints, at least one with equality • Extreme point: satisfies all constraints, two with equality.
The plastic constraint: 2X1+X2<=1200 The Plastic constraint Productionmix constraint: X1-X2<=450 X2 1200 Total production constraint: X1+X2<=800 600 Infeasible Production Time 3X1+4X2 <=2400 (200, 200) * (550,100) * (300,0) * X1 600 800 Extreme point Interior point Boundary point
If a linear programming has an optimal solution , an extreme point is optimal.
Summery of graphical solution procedure 1- graph constraint to find the feasible point 2- set objective function equal to an arbitrary value so that line passes through the feasible region. 3- move the objective function line parallel to itself until it touches the last point of the feasible region . 4- solve for X1 and X2 by solving the two equation that intersect to determine this point 5- substitute these value into objective function to determine its optimal solution.
Example 2.1-1(The Reddy Mikks Company) • Reddy Mikks produces both interior and exterior paints from two raw materials M1 and M2 Tons of raw material per ton of Exterior paint Interior paint Maximum daily availability (tons) Raw material M1 6 4 24 Raw material M2 1 2 6________ Profit per ton ($1000) 5 4 -Daily demand for interior paint cannot exceed that of exterior paint by more than 1 ton -Maximum daily demand of interior paint is 2 tons -Reddy Mikks wants to determine the optimum product mix of interior and exterior paints that maximizes the total daily profit
Solution: Let x1 = tons produced daily of exterior paint x2 = tons produced daily of interior paint Let z represent the total daily profit (in thousands of dollars) Objective: Maximize z = 5x1 + 4x2 (Usage of a raw material by both paints) < (Maximum raw material availability) Usage of raw material M1 per day = 6x1 + 4x2 tons Usage of raw material M2 per day = 1x1 + 2x2 tons - daily availability of raw material M1 is 24 tons - daily availability of raw material M2 is 6 tons
Restrictions: 6x1 + 4x2 <24 (raw material M1) x1 + 2x2 < 6 (raw material M2) - Difference between daily demand of interior (x2) and exterior (x1) paints does not exceed 1 ton, so x2 -x1 < 1 • Maximum daily demand of interior paint is 2 tons, so x2 <2 - Variables x1 and x2 cannot assume negative values, so x1> 0 , x2 > 0
Complete Reddy Mikks model: Maximize z = 5x1 + 4x2 (total daily profit) subject to 6x1 + 4x2 <24 (raw material M1) x1 + 2x2 < 6 (raw material M2) x2 -x1 < 1 x2 <2 x1> 0 x2 > 0 - Objective and the constraints are all linear functions in this example.
Properties of the LP model: Linearity implies that the LP must satisfy three basic properties: 1) Proportionality: - contribution of each decision variable in both the objective function and constraints to be directly proportional to the value of the variable 2) Additivity: - total contribution of all the variables in the objective function and in the constraints to be the direct sum of the individual contributions of each variable 3) Certainty: - All the objective and constraint coefficients of the LP model are deterministic (known constants) - LP coefficients are average-value approximations of the probabilistic distributions - If standard deviations of these distributions are sufficiently small , then the approximation is acceptable - Large standard deviations can be accounted for directly by using stochastic LP algorithms or indirectly by applying sensitivity analysis to the optimum solution
Example 2.1-2(Problem Mix Model) • Two machines X and Y • X is designed for 5-ounce bottles • Y is designed for 10-ounce bottles • X can also produce 10-ounce bottles with some loss of efficiency • Y can also produce 5-ounce bottles with some loss of efficiency
Machine 5-ounce bottles 10-ounce bottles X 80/min 30/min Y 40/min 50/min • X and Y machines can run 8 hours per day for 5 days a week • Profit on 5-ounce bottle is 20 paise • Profit on 10-ounce bottle is 30 paise • Weekly production of the drink cannot exceed 500,000 ounces • Market can utilize 30,000 (5-ounce) bottles and 8000 (10-ounce) bottles per week • To maximize the profit
Solution: Let x1 = number of 5-ounce bottles to be produced per week x2 = number of 10-ounce bottles to be produced per week Objective: Maximize profit z = Rs (0.20x1 + 0.30x2) Constraints: - Time constraint on machine X, (x1/80) + (x2/30) < 8 X 60 X 5 = 2400 minutes - Time constraint on machine Y, (x1/40) + (x2/50) < 8 X 60 X 5 = 2400 minutes -Weekly production of the drink cannot exceed 500,000 ounces, 5x1 + 10x2< 500,000 ounces - Market demand per week, x1> 30,000 (5-ounce bottles) x2> 8,000 (10-ounce bottles)
Example 2.1-3 (Production Allocation Model) • Two types of products A and B • Profit of Rs.4 on type A • Profit of Rs.5 on type B • Both A and B are produced by X and Y machines Machine Machine Products X Y A 2 minutes 3 minutes B 2 minutes 2 minutes - Machine X is available for maximum 5 hours and 30 minutes during any working day - Machine Y is available for maximum 8 hours during any working day - Formulate the problem as a LP problem.
Solution: Let x1 = number of products of type A x2 = number of products of type B Objective: • Profit of Rs.4 on type A , therefore 4x1 will be the profit on selling x1 units of type A • Profit of Rs.5 on type B, therefore 5x2 will be the profit on selling x2 units of type B Total profit, z = 4x1 + 5x2 Constraints: • Time constraint on machine X, 2x1 + 2x2< 330 minutes • Time constraint on machine Y, 3x1 + 2x2< 480 minutes • Non-negativity restrictions are, x1> 0 and x2> 0
Complete LP model is, Maximize z = 4x1 + 5x2 subject to 2x1 + 2x2< 330 minutes 3x1 + 2x2< 480 minutes x1> 0 x2> 0
2.2 GRAPHICAL LP SOLUTION The graphical procedure includes two steps: • Determination of the feasible solution space. • Determination of the optimum solution from among all the feasible points in the solution space.
1 2 3 4 5 6 2.2.1 Solution of a Maximization model Example 2.2-1 (Reddy Mikks model) Step 1: 1) Determination of the feasible solution space: - Find the coordinates for all the 6 equations of the restrictions (only take the equality sign) 6x1 + 4x2 <24 x1 + 2x2 < 6 x2 -x1 < 1 x2 <2 x1> 0 x2 > 0
1 2 3 4 5 6 - Change all equations to equality signs 6x1 + 4x2 =24 x1 + 2x2 = 6 x2 -x1 =1 x2 = 2 x1 = 0 x2 = 0
- Plot graphs of x1 = 0 and x2 = 0 - Plot graph of 6x1 + 4x2 = 24 by using the coordinates of the equation -Plot graph of x1 + 2x2 = 6 by using the coordinates of the equation -Plot graph of x2 -x1 =1 by using the coordinates of the equation -Plot graph of x2 = 2 by using the coordinates of the equation
- Now include the inequality of all the 6 equations - Inequality divides the (x1, x2) plane into two half spaces , one on each side of the graphed line - Only one of these two halves satisfies the inequality - To determine the correct side , choose (0,0) as a reference point - If (0,0) coordinate satisfies the inequality, then the side in which (0,0) coordinate lies is the feasible half-space , otherwise the other side is - If the graph line happens to pass through the origin (0,0) , then any other point can be used to find the feasible half-space
Step 2: 2) Determination of the optimum solution from among all the feasible points in the solution space: - After finding out all the feasible half-spaces of all the 6 equations, feasible space is obtained by the line segments joining all the corner points A, B, C, D ,E and F - Any point within or on the boundary of the solution space ABCDEF is feasible as it satisfies all the constraints - Feasible space ABCDEF consists of infinite number of feasible points
1 2 1 2 - To find optimum solution identify the direction in which the maximum profit increases , that is z = 5x1 + 4x2 - Assign random increasing values to z , z = 10 and z = 15 5x1 + 4x2 = 10 5x1 + 4x2 = 15 - Plot graphs of above two equations - Thus in this way the optimum solution occurs at corner point C which is the point in the solution space - Any further increase in z that is beyond corner point C will put points outside the boundaries of ABCDEF feasible space - Values of x1 and x2 associated with optimum corner point C are determined by solving the equations and 6x1 + 4x2 =24 x1 + 2x2 = 6 - x1 = 3 and x2 = 1.5 with z = 5 X 3 + 4 X 1.5 = 21 - So daily product mix of 3 tons of exterior paint and 1.5 tons of interior paint produces the daily profit of $21,000 .
1 - Important characteristic of the optimum LP solution is that it is always associated with a corner point of the solution space (where two lines intersect) - This is even true if the objective function happens to be parallel to a constraint - For example if the objective function is, z = 6x1 + 4x2 - The above equation is parallel to constraint of equation - So optimum occurs at either corner point B or corner point C when parallel - Actually any point on the line segment BC will be an alternative optimum - Line segment BC is totally defined by the corner points B and C
- Since optimum LP solution is always associated with a corner point of the solution space, so optimum solution can be found by enumerating all the corner points as below:- ______________Corner point (x1,x2) z_________________ A (0,0) 0 B (4,0) 20 C (3,1.5) 21 (optimum solution) D (2,2) 18 E (1,2) 13 F (0,1) 4 - As number of constraints and variables increases , the number of corner points also increases
2.2.2 Solution of a Minimization model Example 2.2-3 • Firm or industry has two bottling plants • One plant located at Coimbatore and other plant located at Chennai • Each plant produces three types of drinks Coca-cola , Fanta and Thumps-up
Number of bottles produced per day by plant at Coimbatore Chennai______________________ Coca-cola 15,000 15,000 Fanta 30,000 10,000 Thumps-up 20,000 50,000_______________________ Cost per day 600 400 (in any unit) • Market survey indicates that during the month of April there will be a demand of 200,000 bottles of Coca-cola , 400,000 bottles of Fanta , and 440,000 bottles of Thumps-up • For how many days each plant be run in April so as to minimize the production cost , while still meeting the market demand?
1 2 3 4 5 Solution: Let x1 = number of days to produce all the three types of bottles by plant at Coimbatore x2 = number of days to produce all the three types of bottles by plant at Chennai Objective: Minimize z = 600 x1 + 400 x2 Constraint: 15,000 x1 + 15,000 x2> 200,000 30,000 x1 + 10,000 x2> 400,000 20,000 x1 + 50,000 x2> 440,000 x1> 0 x2> 0