Download
1 / 15
150 likes | 337 Views
Dynamic and Static Tracepoints using Eclipse, GDB and LTTng. Marc Khouzam, Ericsson Canada marc.khouzam@ericsson.com. Agenda. The need The solution GDB’s enhanced tracepoint feature Dynamic Tracepoints and Eclipse demo Static tracepoints Trace data visualization and Eclipse demo

E N D
Dynamic and Static Tracepoints using Eclipse, GDB and LTTng Marc Khouzam, Ericsson Canada marc.khouzam@ericsson.com
Agenda • The need • The solution • GDB’s enhanced tracepoint feature • Dynamic Tracepoints and Eclipse demo • Static tracepoints • Trace data visualization and Eclipse demo • Questions
The need • Extremely low intrusiveness • For live sites • To be able to reproduce some race conditions • Support for different architectures and operating systems • Support for multi-processes, multi-cores, multi-processors • Can be used by designers, testers, integrators, network operators • Can work with third-party components
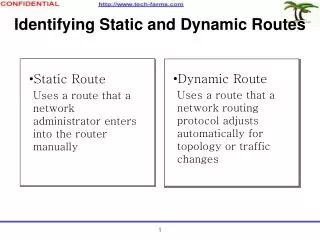
The solution • Highly efficient tracing tool • Support for Dynamic Tracepoints • Added dynamically while code is executing • Support for Static Tracepoints • Added in the source code, before compilation • Support for disconnected tracing • Ability to set tracepoints then disconnect while data collection continues
The solution • GDB (GNU Debugger) • Enhanced dynamic tracepoints • New control of static tracepoints • LTTng and UST (new User Space Tracing) • Can be controlled at run-time by GDB • Eclipse • Extending the existing DSF-GDB integration
GDB’s New Tracepoint Feature • Supporting both Dynamic and Static tracepoints • Tracepoint support using gdbserver • Tracing on the host can still be done using gdbserver • Tracepoints implemented by • Breakpoints (slow dynamic tracepoints) • Jump-patching (fast dynamic tracepoints) • User-space LTTng (static tracepoints) • Disconnected data gathering • Observer-mode to enforce tracing instead of debugging
Dynamic Tracepoints (Eclipse Demo) • Creation of tracepoint as is done for breakpoints • Enable/Disable tracepoints • Dynamic condition can be assigned to a tracepoint • Specification of data to be gathered using symbolic expressions and memory addresses (actions) • Pass count per tracepoint to stop tracing automatically • Trace-state variables that can be used in conditions and actions • Tracepoints are only in effect if tracing is enabled
Dynamic Tracepoints • Possible to define global actions (affecting all tracepoints) • Option to use a finite trace buffer or circular trace buffer • Disconnected data gathering • On-disk trace data storage for ‘small’ amounts of data • Automatic timestamp collection on successful tracepoint hit
Two kinds of Dynamic Tracepoints • Slow tracepoints using ptrace interface • using breakpoints and automatic resuming • Fast tracepoints using an in-process library • using jump patches • restricted to 5 bytes instructions • will give error or use slow tracepoint if installation fails • if condition of tracepoint is false, the tracepoint will take < 100nS • Eclipse support could be implicit or explicit
Static Tracepoints • Creation of tracepoint is done by designer before compilation As for Dynamic tracepoints: • Enable/Disable tracepoints dynamically • Dynamic condition can be assigned to a tracepoint • Can additionally have dynamic tracing specified using symbolic expressions and memory addresses (actions) • Pass count per tracepoint to stop tracing automatically • Trace-state variables that can be used in conditions and actions
Static Tracepoints Also like Dynamic Tracepoints: • Possible to define global actions (affecting all tracepoints) • Option to use a finite trace buffer or circular trace buffer • Disconnected data gathering • On-disk trace data storage for ‘small’ amounts of data • Automatic timestamp collection on successful tracepoint hit
Static Tracepoints provided by LTTng • Using User-space LTTng library • Program to be traced is linked with LTTng library • During tracing, user program calls LTTng library which calls GDB’s in-process library • Write data to the same in-process buffer as dynamic tracepoints • Can be listed by GDB
Trace Data Visualization (Eclipse demo) • Navigation through data records using GDB • Each data record is a snapshot of debug information • Records can be examined using standard debugger views • As if debugger was attached at a specific point in time • Only collected information can be shown • Highlighting of the tracepoint of interest • All collected data of a record can also be dumped as plain text • Trace data can be saved to file • Saved trace data can be examined offline
Extended Trace Data Visualization • GDB trace data is just another time of trace data • Can be visualized using Tracing Monitor Framework views • Correlation between Debugging view and Tracing views • Planned future work