Download
1 / 14
140 likes | 260 Views
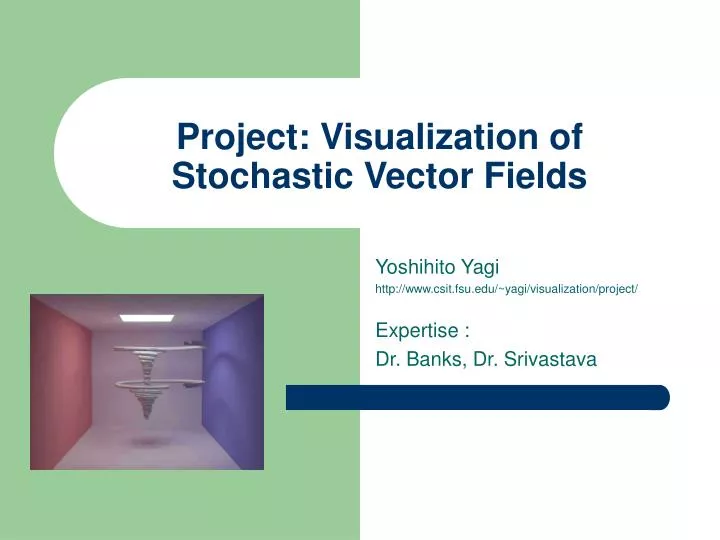
Project: Visualization of Stochastic Vector Fields. Yoshihito Yagi http://www.csit.fsu.edu/~yagi/visualization/project/ Expertise : Dr. Banks, Dr. Srivastava. Goal and Motivation. Goal :

E N D
Project: Visualization of Stochastic Vector Fields Yoshihito Yagi http://www.csit.fsu.edu/~yagi/visualization/project/ Expertise : Dr. Banks, Dr. Srivastava
Goal and Motivation • Goal : • generate plausible streamlines and estimate their density from given a vector field that contains errors. • Motivation : • “Majority of 2D graphs represent errors within the experimental or simulated data.”[2] • “It’s equally important to represent error and uncertainty in 2D and 3D visualization.”[2]
Stochastic Vector fields • Vector fields contain random errors. • White (Uncorrelated) Noise: • In R3 ( x1(t), x2(t), x3(t) ) • Mean: x(t) = 0 • Uncorrelated: x(s) x(t) = (t-s)
Integration • Normal Vector Field • Stochastic Vector Field
Integration • First Order Approximation
Integration • First Order Approximation • Assume mean and sigma are constants
Example1: evenly spaced vectors. • “Creating Evenly-Spaced Streamlines of Arbitrary Density” • Bruno Jobard, Wilfrid Lefer
Example2: single dragger • Generate streamlines from a dragger. • Use timer and recreate streamlines.
Example3: multiple draggers • Generate streamlines from multiple draggers.
Example4: big tube • One big tube covers all possible streamlines.
Example5: transparency • Apply transparency.
Example6: density by amira • When streamlines are generated, their position are recorded. Amira shows isosurface.
Future Works • Better implementation. • Use better function which creates random errors. • Read dataset.
Thanks. • Reference: • [1] D.C. Banks and A. Srivastava, Rendering Stochastic Flows, 2001 • [2] C.R. Johnson and A.R. Sanderson, A Next Step: Visualizing Errors and Uncertainty, 2003