Download
1 / 1
10 likes | 205 Views
Extending the Use of Archived ITS Data As a Potential Management Tool to Evaluate Traveler Information on Dynamic Message Signs. 10 -12 Min. 8 -10 Min. Priya Chavan , Dr. Kristin Tufte , Max Stephens , Dr. Christopher Monsere , Dr Robert Bertini Portland State University.

E N D
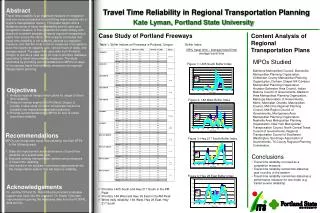
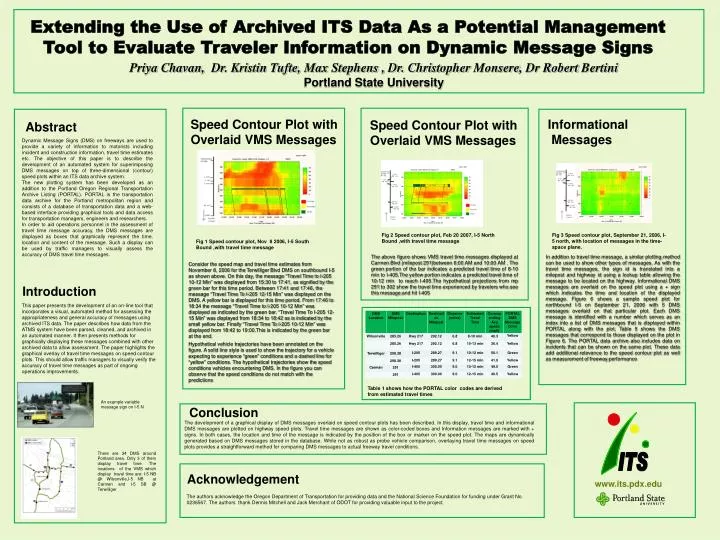
Extending the Use of Archived ITS Data As a Potential Management Tool to Evaluate Traveler Information on Dynamic Message Signs 10 -12 Min 8 -10 Min PriyaChavan, Dr. Kristin Tufte, Max Stephens , Dr. Christopher Monsere, Dr Robert Bertini Portland State University Speed Contour Plot with Overlaid VMS Messages Informational Messages Speed Contour Plot with Overlaid VMS Messages Abstract Dynamic Message Signs (DMS) on freeways are used to provide a variety of information to motorists including incident and construction information, travel time estimates etc. The objective of this paper is to describe the development of an automated system for superimposing DMS messages on top of three-dimensional (contour) speed plots within an ITS data archive system. The new plotting system has been developed as an addition to the Portland Oregon Regional Transportation Archive Listing (PORTAL). PORTAL is the transportation data archive for the Portland metropolitan region and consists of a database of transportation data and a web-based interface providing graphical tools and data access for transportation managers, engineers and researchers. In order to aid operations personnel in the assessment of travel time message accuracy, the DMS messages are displayed as boxes that graphically represent the time, location and content of the message. Such a display can be used by traffic managers to visually assess the accuracy of DMS travel time messages. Fig 2 Speed contour plot, Feb 20 2007, I-5 North Bound ,with travel time message Fig 3 Speed contour plot, September 21, 2006, I-5 north, with location of messages in the time-space plane. Fig 1 Speed contour plot, Nov 8 2006, I-5 South Bound ,with travel time message The above figure shows VMS travel time messages displayed at Carmen Blvd (milepost 291)between 6:00 AM and 10:00 AM . The green portion of the bar indicates a predicted travel time of 8-10 min to I-405.The yellow portion indicates a predicted travel time of 10-12 min to reach I-405.The hypothetical projections from mp 291 to 302 show the travel time experienced by travelers who see this message and hit I-405 In addition to travel time message, a similar plotting method can be used to show other types of messages. As with the travel time messages, the sign id is translated into a milepost and highway id using a lookup table allowing the message to be located on the highway. Informational DMS messages are overlaid on the speed plot using a + sign which indicates the time and location of the displayed message. Figure 6 shows a sample speed plot for northbound I-5 on September 21, 2006 with 5 DMS messages overlaid on that particular plot. Each DMS message is identified with a number which serves as an index into a list of DMS messages that is displayed within PORTAL along with the plot. Table 5 shows the DMS messages that correspond to those displayed on the plot in Figure 6. The PORTAL data archive also includes data on incidents that can be shown on the same plot. These data add additional relevance to the speed contour plot as well as measurement of freeway performance Consider the speed map and travel time estimates from November 8, 2006 for the Terwilliger Blvd DMS on southbound I-5 as shown above. On this day, the message “Travel Time to I-205 10-12 Min” was displayed from 15:30 to 17:41, as signified by the green bar for this time period. Between 17:41 and 17:46, the message “Travel Time To I-205 12-15 Min” was displayed on the DMS. A yellow bar is displayed for this time period. From 17:46 to 18:34 the message “Travel Time to I-205 10-12 Min” was displayed as indicated by the green bar. “Travel Time To I-205 12-15 Min” was displayed from 18:34 to 18:42 as is indicated by the small yellow bar. Finally “Travel Time To I-205 10-12 Min” was displayed from 18:42 to 19:00.This is indicated by the green bar at the end. Hypothetical vehicle trajectories have been annotated on the figure. A solid line style is used to show the trajectory for a vehicle expecting to experience “green” conditions and a dashed line for “yellow” conditions. The hypothetical trajectories show the speed conditions vehicles encountering DMS. In the figure you can observe that the speed conditions do not match with the predictions Introduction This paper presents the development of an on-line tool that incorporates a visual, automated method for assessing the appropriateness and general accuracy of messages using archived ITS data. The paper describes how data from the ATMS system have been parsed, cleaned, and archived in an automated manner. It then presents methods for graphically displaying these messages combined with other archived data to allow assessment. The paper highlights the graphical overlay of travel time messages on speed contour plots. This should allow traffic managers to visually verify the accuracy of travel time messages as part of ongoing operations improvements. Table 1 shows how the PORTAL color codes are derived from estimated travel times An example variable message sign on I-5 N Conclusion The development of a graphical display of DMS messages overlaid on speed contour plots has been described. In this display, travel time and informational DMS messages are plotted on highway speed plots. Travel time messages are shown as color-coded boxes and Information messages are marked with + signs. In both cases, the location and time of the message is indicated by the position of the box or marker on the speed plot. The maps are dynamically generated based on DMS messages stored in the database. While not as robust as probe vehicle comparison, overlaying travel time messages on speed plots provides a straightforward method for comparing DMS messages to actual freeway travel conditions. There are 34 DMS around Portland area. Only 3 of them display travel time. The locations of the VMS which display travel time are: I-5 NB @ Wilsonville,I-5 NB at Carmen and I-5 SB @ Terwilliger Acknowledgement www.its.pdx.edu The authors acknowledge the Oregon Department of Transportation for providing data and the National Science Foundation for funding under Grant No. 0236567. The authors thank Dennis Mitchell and Jack Merchant of ODOT for providing valuable input to the project.