Download
1 / 7
70 likes | 180 Views
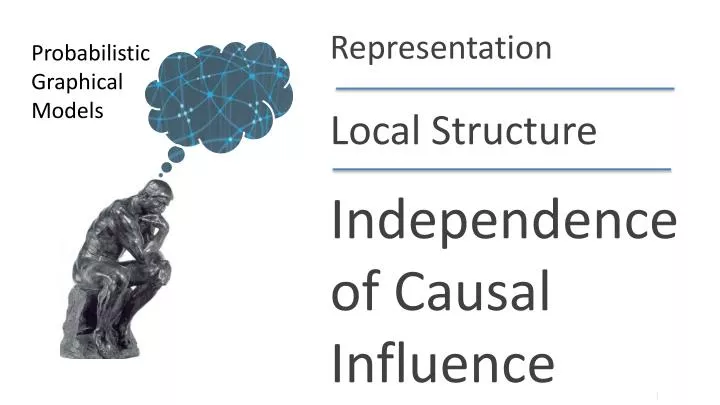
Representation. Probabilistic Graphical Models. Local Structure. Independence of Causal Influence. Pneu - monia. Flu. TB. Bron - chitis. Cough. Noisy OR CPD. X 1. X 2. X k. Z 0. Z 1. Z 2. Z k. P(Z 0 =1) = 0. X i =0. P( Z i =1|X i ) =. Y. X i =1.

E N D
Representation Probabilistic Graphical Models Local Structure Independence of Causal Influence
. . . Pneu- monia Flu TB Bron- chitis Cough
Noisy OR CPD X1 X2 Xk . . . Z0 Z1 Z2 Zk P(Z0=1) =0 Xi=0 P(Zi=1|Xi) = Y Xi=1
Independence of Causal Influence X1 X2 Xk . . . Z0 Z1 Z2 Zk Z Y
Sigmoid CPD X1 X2 Xk . . . Z1 Z2 Zk Z Y
Behavior of Sigmoid CPD w0 = -5 multiply w and w0 by 10
CPCS M. Pradhan G. Provan B. Middleton M. Henrion UAI 1994 # of parameters: 133,931,430 to 8254