Download
1 / 31
310 likes | 435 Views
Drivers of commercialisation in agriculture in Vietnam Andy McKay and Chiara Cazzuffi University of Sussex, UK Paper in progress as part of a DANIDA/BSPS project with CIEM and UoC Joint with Luu Duc Khai and Lien Huong Do. Introduction.

E N D
Drivers of commercialisation in agriculture in Vietnam Andy McKay and Chiara Cazzuffi University of Sussex, UK Paper in progress as part of a DANIDA/BSPS project with CIEM and UoC Joint with Luu Duc Khai and Lien Huong Do
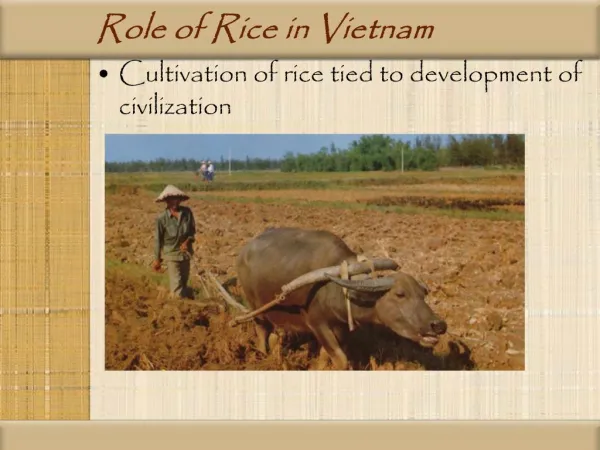
Introduction ♦ Part of in depth analysis of VARHS data, follow up to descriptive report which looks only briefly to the issue of commercialisation. ♦ Aim is to understand what factors influence market participation behaviour, with respect to: (a) the decision to grow cash crops: coffee, tea, cocoa, cashew nuts, sugar cane, pepper, rubber. (b) the decision to sell rice: surplus (temporary or permanent); or to meet immediate expenditure needs ♦ Many actors involved, but we focus on household end of commercialisation process; ♦ Focus on crop cultivation only.
Introduction (ctd.) ♦ Focus so far on cross sections 2006 & 2008; only preliminary insights from panel ♦ Analysis without sample weights in order to have a larger sample ♦ Focus on role of land titling, credit access, training & extension, group membership, rural infrastructure, socio-economic characteristics ♦ In context of sharp food price increases ♦ Very preliminary results to invite comments and develop understanding
World market price for coffee and rice, 2002-2009, US cents/kg
VARHS 2006 and 2008 • 89% of sampled households (hh) are engaged in agriculture in 2006; 91% in 2008. • Of these, 19% produce cash crops (CC) in 2006; 21% in 2008. Majority also grow rice. • 75% of hh doing agriculture produce rice in 2006; 88% in 2008. • Of these, 37% sell rice in 2006; 48% in 2008. • Within the panel, there is a net movement of people into rice production and sales, while there is little change in cash cropping. • Hh that produce cash crops and hh that sell rice are better off than their counterparts than don't in terms of food expenditure per capita
Outline - Cash crops - province profile of cash cropping - characteristics of cultivating households - econometric analysis (cross sections) - mobility within the panel - Rice sales - characteristics of hh that sell - summary of econometric results (cross sections) - mobility within the panel - Conclusions
Cash crop growers compared to hh doing agriculture but not producing cash crops: 1. More likely to be in top food expenditure quintile, and more so in 2008 than in 2006 2. Mean income from agriculture is twice as high for cash cropping hh in 2006, and almost 3 times higher in 2008 3. Land area is about double for cash cropping hh in both years 4. Input cost per unit of land is much higher in 2008, and it is higher for cash cropping hh 5. More likely to hire labour, and much more so in 2008 than in 2006 6. More likely to borrow: 15% more likely in 2006, 39% more likely in 2008 7. Socio-economic characteristics of the hh head: more likely to be male, speaking Vietnamese and able to read & write, and less likely to be minority, in both years 8. More likely to have at least one hh member in farmer union and in women union, in both years 9. Results are stronger in the most dominant coffee growing provinces.
Modelling strategy We want to understand the correlates of growing cash crops. We look at whether some household and production characteristics have a significant association with growing cash crops. We use a probit model with a 0-1 dependent variable, where 1 means that the hh is producing cash crops, and 0 that it is not. At this stage we are not making assumptions about causality.
Robust z-statistics in parentheses; *** p<0.01, ** p<0.05, * p<0.1 Above showed selected results. Additional variables used include: household characteristics, access to extension services, access to credit, land titling
Main Results: strongest correlates of cash cropping Land area: strongest message, consistent across food expenditure quintiles (FEQ) in both years Restricted land Inputs expenditure: consistent across FEQ in both years Market & own transport; market consistent across FEQ Ethnicity: minorities are less likely Women's union
Mobility in cash cropping: panel 0608, characteristics take 2006 values
Mobility in cash cropping: panel 0608Characteristics take 2006 values
Key points: HH that stop compared to hh that continue: less income from agriculture, less land, less inputs expenditure; HH that start compared to hh that never produce: more land, less irrigated land, more likely to be poor and to be member of women's union.
Rice production and sales Cross sections: • Share of hh growing rice increases from 75% in 2006 to 82% in 2008. • Share of hh growing and selling increases from 37% in 2006 to 48% in 2008. • Proportion of quantity sold (conditional on selling) is unchanged between 2006 and 2008; Panel: • 92% of panel hh produce rice both years. • Of these, 35% sell some rice in both years. • 18% of rice producers start selling in 2008. • 14% of rice producers stop selling in 2008.
Rice sales by food expenditure quintiles • Bottom FEQ most likely to grow rice in both years; decline in % of rice growers in top quintile in 2008. • Share of households growing & selling rice is relatively constant across quintiles in 2006. • Richer households sell a higher proportion of output.
Socio-economic characteristics - cross sections; sample: hh producing rice
Compared to hh that produce but do not sell rice, hh that produce and sell rice: Have more land, more irrigated land, more inputs, and are and more likely to have borrowed. Are less likely to be poor; more likely to have access to extension or training.
Summary of econometric results A similar economic model to the one estimated for cash cropping was also estimated for the probability of selling rice. The main results confirm the importance of many of the factors identified in the descriptive analysis. Strongest correlates with the probability of selling rice: More land, more irrigated land, more restricted land, more likely to have hired labour, more likely to be an ethnic minority, more likely to have access to extension Land, training and hired labour consistent across FEQ Market: consistent across FEQ in 2008.
Robust z-statistics in parentheses; *** p<0.01, ** p<0.05, * p<0.1
Mobility in rice sales: panel 0608,characteristics take 2006 values
Mobility in rice sales: panel 0608,characteristics take 2006 values
Key points HH that stop compared to hh that continue: less land, less irrigated land, less inputs expenditure, borrow less; more likely to be minority, more likely to be poor, less likely to be member of women's or farmers union. HH that start compared to hh that never sell rice: more restricted land, more irrigated land, more inputs; Less likely to be male-headed, less likely to be poor, more likely to be member of a farmers union.
Conclusions Significant increase in proportion of hh growing rice and of rice sellers, perhaps as response to rice price increase over the period. Small increase in the proportion of hh growing cash crops. Important factors for both rice and cash crops: land size, input expenses, market infrastructure (presence of daily market in commune) and possibly access to extension/training and hh ownership of means of transport. Important across quintiles.
Conclusions (ctd.) In predominantly cash crops regions, having a red book for cultivated land and having access to credit are important determinants for production of cash crops. Irrigated land, restricted land as well as land area are important determinants for rice sales. Being a member of farmers union or women's union seems to be an important factor for starting cash crop production or rice sales.
Further work Preliminary results for comment and development Possible areas for development: Correlates of rice quantities sold conditional on selling More in depth analysis of the impacts of rice price change Panel dynamics Land area allocated to cash crops Consider other definitions of cash crops, e.g. fruits Consider livelihood compositions of hh producing cash crops or selling rice Determinants of channel of sales (e.g trader or market)