Download
1 / 23
230 likes | 339 Views
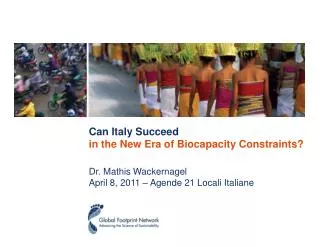
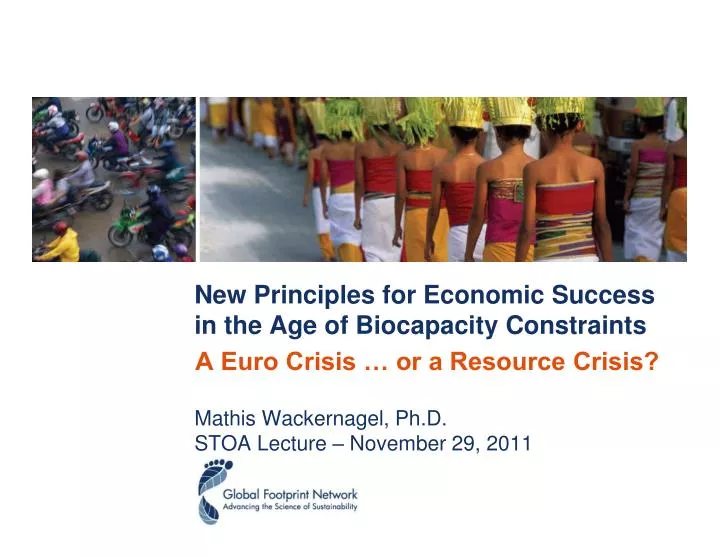
New Principles for Economic Success in the Age of Biocapacity Constraints Mathis Wackernagel, Ph.D. STOA Lecture – November 29, 2011. A Euro Crisis … or a Resource Crisis?. Ecological Creditors and Ecological Debtors. 3. Ecological Creditors and Ecological Debtors. “ today ”. 4.

E N D
New Principles for Economic Success in the Age of Biocapacity Constraints Mathis Wackernagel, Ph.D. STOA Lecture – November 29, 2011 A Euro Crisis … or a Resource Crisis?
Ecological Creditors and Ecological Debtors “today” 4 Global Footprint --------------------------- = 1.5 Global Biocapacity
The Ecological Footprint CARBON footprint 5
Accounting Framework for Ecological Services Biocapacity:How much bioproductive area isavailable to us? Ecological Footprint:How much bioproductive area do wedemand? 6
The Basic Equation Amount per year Yield = ------------------------- Area
The Basic Equation Amount per year Area = ------------------------- Yield Translate area from ha into global ha…
Italy Ecological Footprintper person Biocapacity per person 9
Italy Ecological Footprintper person Biocapacity per person Composition of Italy’s Biocapacity Deficit
Commodity prices (WB index) Source: World Bank – pink sheet 11
Italy Biocapacity Deficit x World Commodity Prices = Cost of Biocapacity Deficit 12
Cost of Italy’s Biocapacity Deficit (WMP of all that cannot be renewed within Italy) Italy’s GDP per person Italy’s Biocapacity Deficit 13
Change in Italian’s relative income Italy’s Biocapacity Deficit 14
DE BY AT BE DK FR ES SK FI GR HU NL IT IR PO RU RO UK PT CZ SE UA CH RS Ecological Creditors and Ecological Debtors in Europe Ecological Footprint and Biocapacity PER CAPITA,1961-2005 15
Costs of resources Ecuador’s residents consume but Ecuador’s ecosystems cannot regenerate (at world market price)
Factory world… or? Biocapacity Deficit and Absolute Income (1980 – 2007)
…global auction? Biocapacity Deficit and Global Income Share (1980 – 2007)
Insights • Downward escalator of resource costs outpaces economies’ ability to run upwards. • Euro crisis is a symptom of a deepening resource crunch. • Turning around resource trends is a necessary condition for Europe’s economy to recover. 22
New principles • Nature has a budget. Do you know how much biocapacity you have? and how much you use? • Biocapacity is the currency of the 21st century. Blindness to biocapacity budget costs lives & opportunities. • Self-interest for countries and cities to act is overwhelming 23 mathis@footprintnetwork.org