Download
1 / 31
310 likes | 415 Views
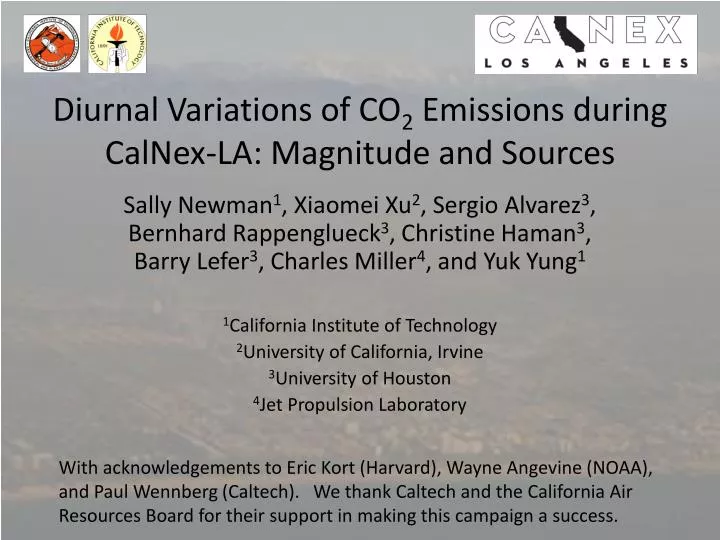
Diurnal Variations of CO 2 Emissions during CalNex -LA: Magnitude and Sources. Sally Newman 1 , Xiaomei Xu 2 , Sergio Alvarez 3 , Bernhard Rappenglueck 3 , Christine Haman 3 , Barry Lefer 3 , Charles Miller 4 , and Yuk Yung 1 1 California Institute of Technology

E N D
Diurnal Variations of CO2 Emissions during CalNex-LA: Magnitude and Sources Sally Newman1, Xiaomei Xu2, Sergio Alvarez3, Bernhard Rappenglueck3, Christine Haman3, Barry Lefer3, Charles Miller4, and Yuk Yung1 1California Institute of Technology 2University of California, Irvine 3University of Houston 4Jet Propulsion Laboratory With acknowledgements to Eric Kort (Harvard), Wayne Angevine (NOAA), and Paul Wennberg (Caltech). We thank Caltech and the California Air Resources Board for their support in making this campaign a success.
Major questions to be addressed • How does the magnitude of CO2 emissions vary during the course of a spring day, both in situ and in the atmospheric column? • What is the diurnal variation of the sources of CO2 emissions, from fossil fuel combustion and the biosphere?
Time Series of CO2, CO, and PBLH CO2 by cavity ring-down spectroscopy, CO by vacuum ultraviolet fluorescence, PBLH by Lidar
Time Series of CO2, CO, and PBLH CO2 by cavity ring-down spectroscopy, CO by vacuum ultraviolet fluorescence, PBLH by Lidar, D14C by accelerator mass spectrometry
Diurnal variations in CO2 and CO mixing ratios The CO2 pattern differs from that of CO because of daytime photosynthetic uptake. Concentrations are higher during early mornings on weekends than weekdays.
Weekday and Weekend Diurnal Variation of Boundary Layer Height above Ground Level
Diurnal Variation of CO2 and CO in Excess of Background Levels Background for CO2 = 393.1 ppm, from Palos Verdes Background for CO = 110.8 ppb, from NOAA THD and POC30N 15-35 ppm CO2 and 125-250 ppb CO were added at the surface.
Calculation of Local Contribution to Column CO2 and CO Variation in the planetary boundary layer height dominates the observed CO2 pattern. 0.8-1.9 ppm CO2 and 4-22 ppb CO were added to the column.
Is it reasonable, to first order, to assume no entrainment or advection?
Overnight, there was minimal wind to move air masses or disturb the stable planetary boundary layer. During the day, the footprint at this time of year was very limited. Modeling by Eric Kort, Harvard. Met fields from Wayne Angevine, NOAA.
Comparison of Column CO2 Determined in situ and by TCCON FTS Favorable comparison with TCCON data from JPL during the same time of year supports neglect of advection and entrainment, to first order. TCCON Data Archive:http://tccon.ipac.caltech.edu/. D. Wunch, et al., 2011
Using CO/CO2 measurements to determine the amount of total CO2 emissions from burning of fossil fuels. http://www.greencarmagazine.net
Variation of CO and CO2 Local Contributions with Time of Day
Variation of the Fraction of Local Emissions of CO2 from Fossil Fuels Assuming an emission ratio of CO/CO2 from fossil fuels of 0.011 ± 0.002 (Wunch et al., 2009)
Adding Results from 14CO2 Black circles are from D14C from flask samples aggregated from alternate day mid-afternoon collections.
Allocation of Sources of Local CO2 Emissions There is significant variation in the sources of CO2 emissions on a diurnal timescale.
Conclusions • How does the magnitude of CO2 emissions vary during the course of a spring day, both in situ and in the atmospheric column?In situ CO2 varies 15-20 ppm during the day, whereas total column CO2 only varies 1-1.1 ppm at this time of year.Diurnal patterns are due mainly to variations in boundary layer height, with superimposed anthropogenic and biogenic influences.
What is the diurnal variation of the sources of CO2 emissions, from fossil fuel combustion and the biosphere? Fossil fuel combustion contributes 50 – 100% of the local emissions, ranging from 13 to 23 ppm, whereas the biosphere contributes up to 17 ppm at night and is a sink of up to 2 ppm during the day.
The CO/CO2 ratio is an important tool for determining the contributions of anthropogenic vs biological sources on a time scale as fine as an hourly diurnal pattern. These species can be measured much more frequently and cheaply than the gold standard of 14C.
Conclusions • Diurnal patterns are due mainly to variations in boundary layer height, with superimposed anthropogenic influences. • Using CO/CO2 ratios we can derive the diurnal cycle of both anthropogenic and biogenic emissions.
How does the magnitude of CO2 emissions vary during the course of a spring day, both in situ and in the atmospheric column? • What controls the observed diurnal patterns of CO2 and CO mixing ratios? • Can we use in situ mixing ratios to validate remote sensing measurements? • What is the diurnal variation of the sources of CO2 emissions, from fossil fuel combustion and the biosphere?
Comparison between CalNex-LA (Caltech) and Background Air (Palos Verdes) CO2 Average daily minimum CO2 in Palos Verdes was 393.1 ppm.
Modeling by Eric Kort, Harvard. Met fields from Wayne Angevine, NOAA.
This simple dilution calculation produces a diurnal pattern consistent with column determinations. Unlike remote sensing techniques, in situ measurements can give 24-hour patterns.
Locations of CalNex-LA Ground Campaign (Pasadena) and Background Site (Palos Verdes)