Download
1 / 25
250 likes | 387 Views
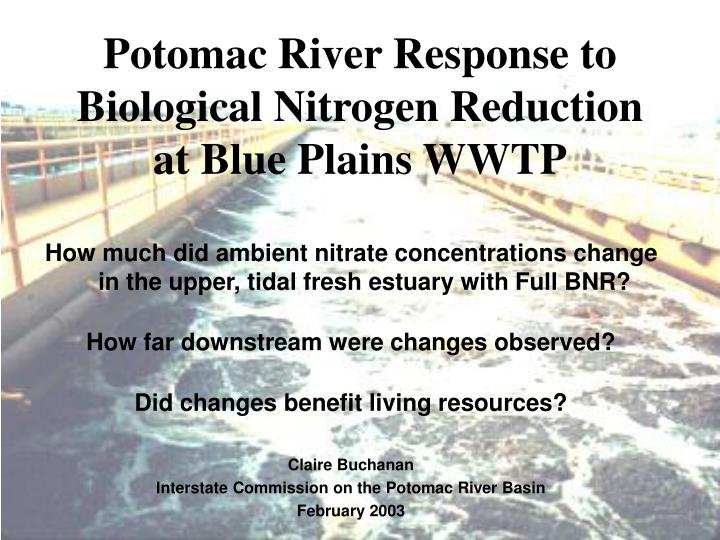
Potomac River Response to Biological Nitrogen Reduction at Blue Plains WWTP. How much did ambient nitrate concentrations change in the upper, tidal fresh estuary with Full BNR? How far downstream were changes observed? Did changes benefit living resources? Claire Buchanan

E N D
Potomac River Response to Biological Nitrogen Reduction at Blue Plains WWTP How much did ambient nitrate concentrations change in the upper, tidal fresh estuary with Full BNR? How far downstream were changes observed? Did changes benefit living resources? Claire Buchanan Interstate Commission on the Potomac River Basin February 2003
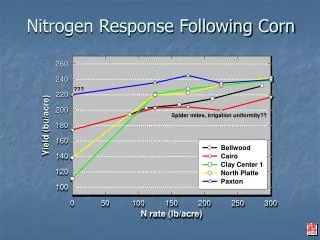
Waste water treatment plants convert ammonia to nitrate in primary treatment. Nitrate is a common form of Dissolved Inorganic Nitrogen (DIN). It is the preferred nitrogen source for many phytoplankton. DIN at 0.07 mg/liter limits excess phytoplankton growth Ambient Nitrate and Total Nitrogen Concentrations in Pre BNR Baseline Period Data from Chesapeake Bay Program Data Center
Mean Daily Total Nitrogen Loads Baseline versus Yr 2001 +10% - 56% Mean Daily Total Nitrogen Loads Combined: - 30% Data from Bill Romano, MDDNR
1990 – 2002 Time Series Straightforward Time Series Suggest Full-BNR Caused Declines in Nitrate Concentrations Along Entire Length of Potomac Estuary Full-BNR nitrate concentrations are significantly (p<0.001) lower than Pre-BNR concentrations from Washington, DC to lower estuary
Flow, Season, Location Flow, Season, Location Affect Ambient Nitrate Concentrations • Data were partitioned into 4 seasons and 5 flow regimes for more accurate Pre- and Full-BNR comparisons • Seasons: Seasonal Flow Regimes* • Winter (Jan – Feb) • Record Dry/Very Dry (<10%) • Spring (Mar – May) • Dry (10% - 33%) • Summer (June – Sept) • Moderate (33% - 67%) • Autumn (Oct – Dec) • Wet (67% - 90%) • • Record Wet/Very Wet (>90%) • 16 of the 20 possible season-flow regimes found in Pre BNR Period • 6 of 8 season-flow regimes in Full BNR Period match regimes in Pre BNR Period (monitoring data currently available for 5 regimes) • *Olson, 2002, based on USGS 1975-1994 adjusted Potomac record at Little Falls
Moderate Summer Conditions • Moderate Summer Conditions • Pre BNR (1990, 1992, 1994, 1995) • Full BNR (2000, 2001) • No significant differences above the Fall Line • Significant (p<0.05) declines of 38%-43% in upper/middle estuary • - Too many BDLs hinder tests for significant differences in lower estuary data • No significant differences between top and bottom layers until near the mouth Above Fall-Line data from USGS and Metropolitan Washington water suppliers; assembled by Norbert Jaworski, retired EPA
Moderate Summer Conditions 1990, 1992, 1994, 1995versus 2000, 2001
Dry Autumn Conditions 1994versus 2000
Very/Record Dry Autumn Conditions 1991 (Very Dry) versus 2001 (Record Dry)
Very/Record Dry Spring Conditions 1995 (Record Dry) versus 2002 (Very or Record Dry)
Dry Winter Conditions Dry Winter Conditions • Pre BNR (1992) • Full BNR (2001) • Few data • No declines are evident….
Blue Plains Effluent TN Concentrations, Pre and Full BNR …because no reductions were made
Lower Estuary Response to Blue Plains Full BNR • Nitrogen levels entering the lower Potomac estuary (~ Rt. 301 Bridge) are still too high for a significant phytoplankton response • Used “Frequency of Threshold Exceedance” to investigate BNR-related changes in lower estuary • Analysis of nitrate data near the mouth of the Potomac is hindered by “below detection limit” values • The Frequency of Threshold Exceedance is a more ecologically meaningful metric than average nitrate concentration
Frequency of Nitrogen-Limitation Threshold Exceedances • The frequency of nitrate concentrations exceeding the phytoplankton “Nitrogen-Limitation Threshold” has decreased in lower estuary in Full BNR period • Difficult to determine from data alone whether the declines in frequency are due to dilution by Bay, upstream BNR, or both • Data suggest at least some of the decline is due to Full BNR
Did BNR Nitrate Reductions Benefit Living Resources? • Lower Estuary - no significant phytoplankton response yet • Upper Estuary - appears to have significantly reduced duration and bloom intensity of Microcystis aeruginosa (bluegreen algae) • comparison of Summer 1991 (Very Dry) and Summer 2002 (Very Dry)
Summary • Ambient nitrate concentrations have significantly declined in the upper and middle tidal Potomac River in response to Blue Plains WWTP Biological Nitrogen Reduction (BNR) • However, nitrate concentrations in these reaches of the estuary, as well as the non-tidal Potomac River, still exceed Fisher & Gustafson’s phytoplankton Nitrogen-Limitation threshold (2003)
Summary (Cont.) • Nitrate has also decreased in the lower estuary, but not to concentrations low enough to significantly limit algal blooms • Concentrations still frequently exceed the nitrogen-limitation threshold, especially at the head of the lower estuary (Rt. 301) • Difficult to determine from two years of monitoring data alone if current BNR (Blue Plains) is solely responsible for nitrate declines in lower estuary • Models could help distinguish influence of Bay mainstem from upstream BNR effects
Summary (Cont.) • For Pre- and Full-BNR Periods with Matching Season-Flow Conditions: • Benefits of BNR were accentuated and concentrated in the upper and middle estuary during dry conditions (drought) • With return to moderate or wet flows, we hypothesize the influence of BNR on the upper and middle estuary will diminish, but the influence on the lower estuary will increase
UPDATE IN PROGRESS Data available • Very Dry Summer (1991 vs 2002) • Wet Spring (1994 vs 2003) Data Pending • Very/Record Wet Summer (1996 vs 2003) • Wet Autumn (1990 vs 2002)
Wet Spring Conditions 1994versus 2003
Location, Season, Flow Can Affect Nitrate Concentrations (Pre-BNR Period: Jan 1990 – Sept 1996)