Download

1 / 54
550 likes | 715 Views
Chapter 5 – Evaluating Classification & Predictive Performance. Data Mining for Business Intelligence Shmueli, Patel & Bruce. Why Evaluate?. Multiple methods are available to classify or predict For each method, multiple choices are available for settings

E N D
Chapter 5 – Evaluating Classification & Predictive Performance Data Mining for Business Intelligence Shmueli, Patel & Bruce
Why Evaluate? • Multiple methods are available to classify or predict • For each method, multiple choices are available for settings • To choose best model, need to assess each model’s performance
Misclassification error • Error = classifying a record as belonging to one class when it belongs to another class. • Error rate = percent of misclassified records out of the total records in the validation data
Naïve Rule • Often used as benchmark: we hope to do better than that • Exception: when goal is to identify high-value but rare outcomes, we may do well by doing worse than the naïve rule (see “lift” – later) Naïve rule: classify all records as belonging to the most prevalent class
Separation of Records “High separation of records” means that using predictor variables attains low error “Low separation of records” means that using predictor variables does not improve much on naïve rule
Confusion Matrix 201 1’s correctly classified as “1” 85 1’s incorrectly classified as “0” 25 0’s incorrectly classified as “1” 2689 0’s correctly classified as “0”
Error Rate Overall error rate = (25+85)/3000 = 3.67% Accuracy = 1 – err = (201+2689) = 96.33% If multiple classes, error rate is: (sum of misclassified records)/(total records)
Cutoff for classification Most DM algorithms classify via a 2-step process: For each record, • Compute probability of belonging to class “1” • Compare to cutoff value, and classify accordingly • Default cutoff value is 0.50 If >= 0.50, classify as “1” If < 0.50, classify as “0” • Can use different cutoff values • Typically, error rate is lowest for cutoff = 0.50
Cutoff Table • If cutoff is 0.50: 13 records are classified as “1” • If cutoff is 0.80: seven records are classified as “1”
When One Class is More Important • Tax fraud • Credit default • Response to promotional offer • Detecting electronic network intrusion • Predicting delayed flights In many cases it is more important to identify members of one class In such cases, we are willing to tolerate greater overall error, in return for better identifying the important class for further attention
Alternate Accuracy Measures If “C1” is the important class, Sensitivity = % of “C1” class correctly classified Sensitivity = n1,1 / (n1,0+ n1,1 ) Specificity = % of “C0” class correctly classified Specificity = n0,0 / (n0,0+ n0,1 ) False positive rate = % of predicted “C1’s” that were not “C1’s” False negative rate = % of predicted “C0’s” that were not “C0’s”
Lift and Decile Charts: Goal Useful for assessing performance in terms of identifying the most important class Helps evaluate, e.g., • How many tax records to examine • How many loans to grant • How many customers to mail offer to
Lift and Decile Charts – Cont. Compare performance of DM model to “no model, pick randomly” Measures ability of DM model to identify the important class, relative to its average prevalence Charts give explicit assessment of results over a large number of cutoffs
Lift and Decile Charts: How to Use Compare lift to “no model” baseline In lift chart: compare step function to straight line In decile chart compare to ratio of 1
Lift Chart – cumulative performance After examining (e.g.,) 10 cases (x-axis), 9 owners (y-axis) have been correctly identified
Decile Chart In “most probable” (top) decile, model is twice as likely to identify the important class (compared to avg. prevalence)
Lift Charts: How to Compute • Using the model’s classifications, sort records from most likely to least likely members of the important class • Compute lift: Accumulate the correctly classified “important class” records (Y axis) and compare to number of total records (X axis)
Lift vs. Decile Charts Both embody concept of “moving down” through the records, starting with the most probable Decile chart does this in decile chunks of data Y axis shows ratio of decile mean to overall mean Lift chart shows continuous cumulative results Y axis shows number of important class records identified
Misclassification Costs May Differ The cost of making a misclassification error may be higher for one class than the other(s) Looked at another way, the benefit of making a correct classification may be higher for one class than the other(s)
Example – Response to Promotional Offer • “Naïve rule” (classify everyone as “0”) has error rate of 1% (seems good) • Using DM we can correctly classify eight 1’s as 1’s It comes at the cost of misclassifying twenty 0’s as 1’s and two 0’s as 1’s. Suppose we send an offer to 1000 people, with 1% average response rate (“1” = response, “0” = nonresponse)
The Confusion Matrix Error rate = (2+20) = 2.2% (higher than naïve rate)
Introducing Costs & Benefits Suppose: • Profit from a “1” is $10 • Cost of sending offer is $1 Then: • Under naïve rule, all are classified as “0”, so no offers are sent: no cost, no profit • Under DM predictions, 28 offers are sent. 8 respond with profit of $10 each 20 fail to respond, cost $1 each 972 receive nothing (no cost, no profit) • Net profit = $60
Lift (again) Adding costs to the mix, as above, does not change the actual classifications Better: Use the lift curve and change the cutoff value for “1” to maximize profit
Generalize to Cost Ratio Sometimes actual costs and benefits are hard to estimate • Need to express everything in terms of costs (i.e., cost of misclassification per record) • Goal is to minimize the average cost per record A good practical substitute for individual costs is the ratio of misclassification costs (e,g,, “misclassifying fraudulent firms is 5 times worse than misclassifying solvent firms”)
Minimizing Cost Ratio q1 = cost of misclassifying an actual “1”, q0 = cost of misclassifying an actual “0” Minimizing the cost ratio q1/q0 is identical to minimizing the average cost per record Software* may provide option for user to specify cost ratio *Currently unavailable in XLMiner
Note: Opportunity costs • As we see, best to convert everything to costs, as opposed to a mix of costs and benefits • E.g., instead of “benefit from sale” refer to “opportunity cost of lost sale” • Leads to same decisions, but referring only to costs allows greater applicability
Cost Matrix (inc. opportunity costs) Recall original confusion matrix (profit from a “1” = $10, cost of sending offer = $1):
Multiple Classes • Theoretically, there are m(m-1) misclassification costs, since any case could be misclassified in m-1 ways • Practically too many to work with • In decision-making context, though, such complexity rarely arises – one class is usually of primary interest For m classes, confusion matrix has m rows and m columns
Adding Cost/Benefit to Lift Curve • Sort records in descending probability of success • For each case, record cost/benefit of actual outcome • Also record cumulative cost/benefit • Plot all records X-axis is index number (1 for 1st case, n for nth case) Y-axis is cumulative cost/benefit Reference line from origin to yn (yn = total net benefit)
Lift Curve May Go Negative If total net benefit from all cases is negative, reference line will have negative slope Nonetheless, goal is still to use cutoff to select the point where net benefit is at a maximum
Rare Cases • Responder to mailing • Someone who commits fraud • Debt defaulter • Often we oversample rare cases to give model more information to work with • Typically use 50% “1” and 50% “0” for training Asymmetric costs/benefits typically go hand in hand with presence of rare but important class
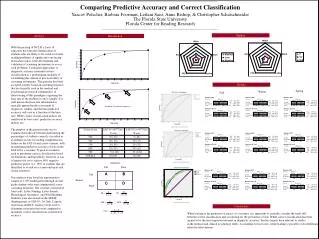
Example Following graphs show optimal classification under three scenarios: • assuming equal costs of misclassification • assuming that misclassifying “o” is five times the cost of misclassifying “x” • Oversampling scheme allowing DM methods to incorporate asymmetric costs
Oversampling Scheme Oversample “o” to appropriately weight misclassification costs
An Oversampling Procedure • Separate the responders (rare) from non-responders • Randomly assign half the responders to the training sample, plus equal number of non-responders • Remaining responders go to validation sample • Add non-responders to validation data, to maintain original ratio of responders to non-responders • Randomly take test set (if needed) from validation
Classification Using Triage • Instead of classifying as C1 or C0, we classify as C1 C0 Can’t say The third category might receive special human review Take into account a gray area in making classification decisions
Measuring Predictive error • Not the same as “goodness-of-fit” • We want to know how well the model predicts newdata, not how well it fits the data it was trained with • Key component of most measures is difference between actual y and predicted y (“error”)