Download
1 / 3
30 likes | 102 Views
Turbulence and noise –results 2000/2001. Pk. Det. BCT. Pk. Det. Pk. Det. V RF. V RF. 10/2001 1 PS batch, 72 bunches 4.0*10 12 total : 5.6 *10 10 / bunch 10.8 s before voltage rise 0.7% /s reduction in peak detected signal. Instability removed by coupled-bunch feedback which

E N D
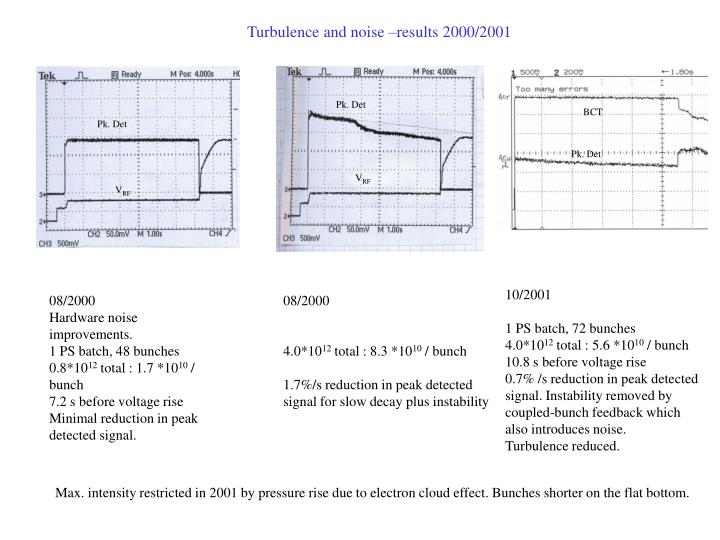
Turbulence and noise –results 2000/2001 Pk. Det BCT Pk. Det Pk. Det VRF VRF 10/2001 1 PS batch, 72 bunches 4.0*1012 total : 5.6 *1010 / bunch 10.8 s before voltage rise 0.7% /s reduction in peak detected signal. Instability removed by coupled-bunch feedback which also introduces noise. Turbulence reduced. 08/2000 Hardware noise improvements. 1 PS batch, 48 bunches 0.8*1012 total : 1.7 *1010 / bunch 7.2 s before voltage rise Minimal reduction in peak detected signal. 08/2000 4.0*1012 total : 8.3 *1010 / bunch 1.7%/s reduction in peak detected signal for slow decay plus instability Max. intensity restricted in 2001 by pressure rise due to electron cloud effect. Bunches shorter on the flat bottom.
Emittance growth during cycle 11/2001 Cycle 537. t = 22.8 4 batches injected, 1.64 * 1013 total, ~ 90% transmission At 450 GeV/c, 1.48 * 1013 total, 3.7 * 1012 / batch, 5.14* * 1010 / bunch. Individual RF feed-back and feed-forward on each cavity. Coupled bunch feedback on main cavity pass-band, (two cavities) High voltage cycle, 6.7 MV, with 800 MHz on 650 kV. Noise introduced by coupled bunch feedback and 800 MHz system – to be improved! After capture, 1200 ms 0.4 eVs End flat bottom 26 GeV (Pk detected 10% height) 0.48 eVs Top energy 1) from bunch length: HHFW 0.6 – 0.69 eVs Baseline 0.7-0.9 eVs 2) from peak detected cf analytic 0.67 eVs Bunch rotation: Drop adiabatically from 6.8 MV to 650 kV. Jump to 6.8 MV (0.5 ms) (J.Tuckmantel) (Using fast counterphasing, T.Bohl) Can gain 40% in bunch length – deduced from peak detected. dp/p increases proportionally. 0.5 ms /div. 50 ms /div.
B train – cycle 537 -2001 Peak in Bdot caused by adjustment of injection energy. (E. Shaposhnikova, T. Bohl, G. Arduini) Increase from 0.0198 T/s to 0.0296 T/s Gives ~ 5% reduction in bucket area for 2 –3 MV Capture loss should occur ~ 11125 ms or earlier Observed loss may come from peak in Bdot Suggestion: re-calculate whole B slope or ar least spread it over a > 4 times longer time-scale Bdot BCT 9800 ms start rise join of new parabola to old Variation in Bdot caused by errors in saturation tables? Bdot varies 0.35 T/s 0.02 T/s Effect on bucket area greatest with matched emittance cycle. 0.6 eVs becomes 0.56 eVs at overshoot. Less important to correct but ... 16800 ms / 350 GeV