Download
1 / 44
440 likes | 626 Views
Got Flood? Understanding Floodplains and their Impacts. 2008 Iowa TSI Pipeline Safety Conference Mark A. Land, P.E. Today’s Presentation:. Floodplain 101 Flood of 2008. Floodplain Terminology. Floodplain Terminology. FLOODPLAIN. Floodplain Terminology. FLOODWAY. FLOODPLAIN.

E N D
Got Flood?Understanding Floodplains and their Impacts 2008 Iowa TSI Pipeline Safety Conference Mark A. Land, P.E.
Today’s Presentation: • Floodplain 101 • Flood of 2008
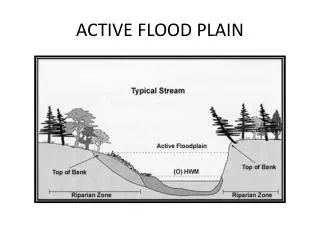
Floodplain Terminology FLOODPLAIN
Floodplain Terminology FLOODWAY FLOODPLAIN
Floodplain Terminology FLOODWAYFRINGE FLOODWAYFRINGE FLOODWAY FLOODPLAIN
Floodplain Terminology FLOODWAYFRINGE FLOODWAYFRINGE STREAM CHANNEL FLOODWAY FLOODPLAIN
Development Impacts FLOODWAY FLOODPLAIN
Development Impacts FLOODWAY FLOODPLAIN
FLOODPLAIN FLOODWAYFRINGE FLOODWAYFRINGE Typical Floodplain FLOODWAY
Why Do We Have Floodplain Regulations? • Iowa Natural Resources Council (1949). • National Flood Insurance Program (NFIP) of 1968. • Allows property owners in participating communities to purchase flood insurance in exchange for federal floodplain management requirements. • Currently only 498 of 947 cities are members. • 136 communities have IDNR delegated authority for floodplain management. • Reduces future flood damage through floodplain management. • Reduces federal expenditures for disaster assistance and flood control.
Why is membership in NFIP important? • Citizens can’t purchase federal flood insurance if city is not a member. • The city is not eligible for federal flood disaster assistance if not a member.
Why are floodplain maps important? Better Construction • Build 1’ above 100-year flood. • Your home has a 26% chance of being damaged by a flood during the course of a 30-year mortgage, compared to a 9% chance of fire. • Outdated or non-existent maps could expand or reduce area.
Why are floodplain maps important? Recovery Plans • Planning to reduce future impacts. • $15 million to update maps.
Squaw Creek can discharge approx. 3,000 CFS with banks full. Peak Flood Flows - CFS • What is a CFS? • Cubic feet per second is a measurement of volume passing by a point every second.
Skunk River, at 13th St., can discharge approx. 3,000 CFS with banks full. At US 30, it can discharge approx. 7,000 CFS with the banks full. Peak Flood Flows - CFS • What is a CFS? • Cubic feet per second is a measurement of volume passing by a point every second. • Squaw Creek can discharge approx. 3,000 CFS with banks full.
Peak Flood Flows - CFS • What is a CFS? • Cubic feet per second is a measurement of volume passing by a point every second. • Squaw Creek can discharge approx. 3,000 CFS with banks full. • Skunk River, at 13th St., can discharge approx. 3,000 CFS with banks full. At US 30, it can discharge approx. 7,000 CFS with the banks full.
During the flood of 1993, 24,300 cubic feet of water per second (CFS) was being discharged on Squaw Creek. Cube 29’x29’x29’ Peak Flood Flows - CFS • What is a CFS? • Cubic feet per second is a measurement of volume passing by a point every second. • Squaw Creek can discharge approx. 3,000 CFS with banks full. • Skunk River, at 13th St., can discharge approx. 3,000 CFS with banks full. At US 30, it can discharge approx. 7,000 CFS with the banks full.
How are Flood Discharge Rates Determined? • System of flood gages. • Gages keep a record of water surface elevations throughout the year. • The water surface elevations are converted to discharges. • USGS Bulletin #17B is used to calculate flood frequency using statistical methods based on the highest discharge calculated in each year.
How are Flood Discharge Rates Determined? Regression Equations – Statistical Analysis to reflect discharges given a specific drainage area and channel slope. EXAMPLE Q100 = 531 x DA 0.542 X MCS 0.313 x (DML+1) -0.549 Q100 = 100 year peak discharge, cfs DA = Drainage Area, Sq. Miles MCS = Main Channel Slope, feet/mile DML = Percent Area with Des Moines Lobe
Probability of Another Flood • What is the meaning of flood probability?
Floodplain Alternatives • Levees Levee Design Flood Water Surface
Floodplain Alternatives • Levees • Channel Excavation Stream Channel Channel Widening
Floodplain Alternatives • Levees • Channel Excavation • Reservoirs
Floodplain Alternatives • Levees • Channel Excavation • Reservoirs • Flood Proofing
Flood of 2008 Flood Data • 83 of 99 counties declared disaster areas
Flood of 2008 Flood Data • 83 of 99 counties declared disaster areas • Over $1 billion in damages reported to FEMA • Roads & Bridges - $55 million • Buildings and equipment - $380 million • Utilities - $342 million
Flood of 2008 Flood Data • 83 of 99 counties declared disaster areas • Over $1 billion in damages reported to FEMA • Roads & Bridges - $55 million • Buildings and equipment - $380 million • Utilities - $342 million • Linn County $600 million
Flood of 2008 Flood Data • 83 of 99 counties declared disaster areas • Over $1 billion in damages reported to FEMA • Roads & Bridges - $55 million • Buildings and equipment - $380 million • Utilities - $342 million • Linn County $600 million • 500 year flood or higher on Cedar River
Floods of 2008 Flood Data • 83 of 99 counties declared disaster areas • Over $1 billion in damages reported to FEMA • Roads & Bridges - $55 million • Buildings and equipment - $380 million • Utilities - $342 million • Linn County $600 million • 500 year flood or higher on Cedar River • Johnson County $15.5 million (not including U of I)
Floods of 2008 What caused the floods? LOTS OF RAIN! • Cedar River basin 10-15” of rain in 14 days with already saturated ground • Development • Levee failures • Agriculture • Loss of Wetlands
Floods of 2008 HOW DO THE 2008 FLOODS COMPARE TO FLOOD OF1993? • Wet and Cool in Spring of Both Years • 1993 Longer Duration over the Summer • 1993 Uniformly High Rainfall Totals • 1993 – All 99 counties disaster areas • 2008 – Roughly half due to flooding • 21 NWS gage stations higher in 2008
Flood Information • www.weather.gov/ahps • National Weather Service Hydrologic Prediction • www.rivergages.com • Corps of Engineers River Gage Information • mesonet.agron.iastate.edu/climodat/ • Rainfall Data • msc.fema.gov • FEMA Floodplain Maps
Flood Information • www.weather.gov/ahps
Flood Information • www.weather.gov/ahps
Flood Information • www.weather.gov/ahps
Flood Information • www.rivergages.com
Flood Information • mesonet.agron.iastate.edu/climodat/
Flood Information • msc.fema.gov
Flood Information • www.weather.gov/ahps • National Weather Service Hydrologic Prediction • www.rivergages.com • Corps of Engineers River Gage Information • mesonet.agron.iastate.edu/climodat/ • Rainfall Data • msc.fema.gov • FEMA Floodplain Maps
Questions? 2008 Iowa TSI Pipeline Safety Conference Mark A. Land, P.E.