Download
1 / 22
230 likes | 444 Views
The Financial Environment: Markets, Institutions,and Interest Rates. Financial markets Types of financial institutions Determinants of interest rates Yield curves. Define the following terms:. Financial vs. physical asset markets Money vs. capital markets Primary vs. secondary markets.

E N D
The Financial Environment: Markets, Institutions,and Interest Rates • Financial markets • Types of financial institutions • Determinants of interest rates • Yield curves
Define the following terms: • Financial vs. physical asset markets • Money vs. capital markets • Primary vs. secondary markets
Financial VS Physical asset Markets • Financial (Asset) Markets- the markets where financial assets are traded. • Physical Asset Markets- the markets where physical (real) assets are traded.
Money VS Capital Markets • Money Markets-The financial markets in which funds are borrowed or loaned for short periods (< or = 1 year). • Capital Markets- The financial markets for stocks and long-term debt (>1 year).
Primary VS Secondary Markets • Primary Markets-Markets in which corporations raise funds by issuing new securities • Secondary Markets- Markets in which securities and other financial assets are traded among investors after they have been issued by corporations and public agencies such as municipalities.
Three Primary Ways Capital Is Transferred Between Savers and Borrowers • Direct transfer • Investment banking house • Financial intermediary
Major Financial Intermediaries • Commercial Banks • Life insurance company • Mutual funds • Financial company
Stock Market • NYSE • Stock Exchange of Thailand
What do we call the price, or cost, of debt capital? The interest rate • What do we call the price, or cost, of equity capital? Required Dividend Capital return yield gain = + .
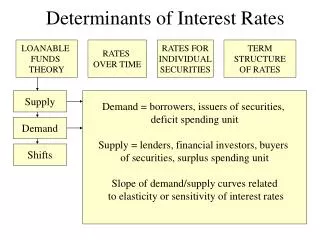
What four factors affect the cost of money? • Production opportunities - Economic situation • Time preferences for consumption • Risk - High risk, high cost • Expected inflation - high inflation,high cost
“Real” Versus “Nominal” Rates = Real risk-free rate. T-bill rate if no inflation; 1% to 4%. = Any nominal rate. = Rate on Treasury securities. k* k kRF
k = k* + IP + DRP + LP + MRP. Here: k = Required rate of return on a debt security. k* = Real risk-free rate. IP = Inflation premium. DRP = Default risk premium. LP = Liquidity premium. MRP = Maturity risk premium.
Premiums Added to k* for Different Types of Debt • S-T Treasury: only IP for S-T inflation • L-T Treasury: IP for L-T inflation, MRP • S-T corporate: S-T IP, DRP, LP • L-T corporate: IP, DRP, MRP, LP
What is the “term structure of interest rates”? What is a “yield curve”? • Term structure: the relationship between interest rates (or yields) and maturities. • A graph of the term structure is called the yield curve.
Interest Rate (%) T-Bond Yield Curve 15 1 yr 6.1% 5 yr 6.6% 10 yr 7.0% 20 yr 7.5% Yield Curve (May 1999) 10 5 Years to Maturity 0 5 10 15 20
Yield curve 1-yr 30-yr k S k k S D D Q Q 1 30 Maturity
Constructing the Yield Curve Example data: • Inflation for Year 1 is 5%. • Inflation for Year 2 is 6%. • Inflation for Year 3 and beyond is 8%. k* = 3%. MRPt = 0.1%(t - 1).
Step 1: Find the average expected inflation rate over years 1 to n: n SINFLt t = 1 n IPn = .
IP1 = 5%/1.0 = 5.00%. IP10 = [ 5 + 6 + 8(8)]/10 = 7.5%. IP20 = [ 5 + 6 + 8(18)]/20 = 7.75%. Must earn these IPs to break even vs. inflation; these IPs would permit you to earn k* (before taxes).
Step 2: Find MRP based on this equation: MRPt = 0.1%(t - 1). MRP1 = 0.1% x 0 = 0.0%. MRP10 = 0.1% x 9 = 0.9%. MRP20 = 0.1% x 19= 1.9%.
Step 3: Add the IPs and MRPs to k*: kT = k* + IPt + MRPt. kT = Quoted market interest rate on Treasury securities. Assume k* = 3%: 1-Yr: kT1 = 3% + 5% + 0.0% = 8.0%. 10-Yr: kT10= 3% + 7.5% + 0.9% = 11.4%. 20-Yr: kT20= 3% + 7.75% + 1.9% = 12.7%.
Yield Curve Examples Continental Airlines (Junk) Interest Rate (%) Exxon (AAA) 15 Treasury yield curve 12.7% 11.4% 10 8.0% 5 Years to maturity 0 1 5 10 15 20