Download
1 / 19
190 likes | 298 Views
Structural characteristics of the Hungarian Agriculture and Food Industry 1990-2004. Rome 29 June – July 2005 Éva Laczka. Joint UNECE /EUROSTAT/FAO/OECD Meeting on Food and Agricultural Statistics in Europe. Structure of my presentation. Introduction Food consumption in Hungary

E N D
Structural characteristics of the Hungarian Agriculture and Food Industry1990-2004 Rome 29 June – July 2005 Éva Laczka Joint UNECE /EUROSTAT/FAO/OECD Meeting on Food and Agricultural Statistics in Europe
Structure of my presentation • Introduction • Food consumption in Hungary • Hungarian Agriculture • Hungarian „Farms” • Hungarian Food Industry • Agriculture and Food Industry in the GDP • Agriculture and Food Industry in Employment • Agriculture and Food Industry in External Trade • Conclusion
Population volumes and Agriculture (per cent)1990-2004 (Index: average of years 1999-2001=100,0)
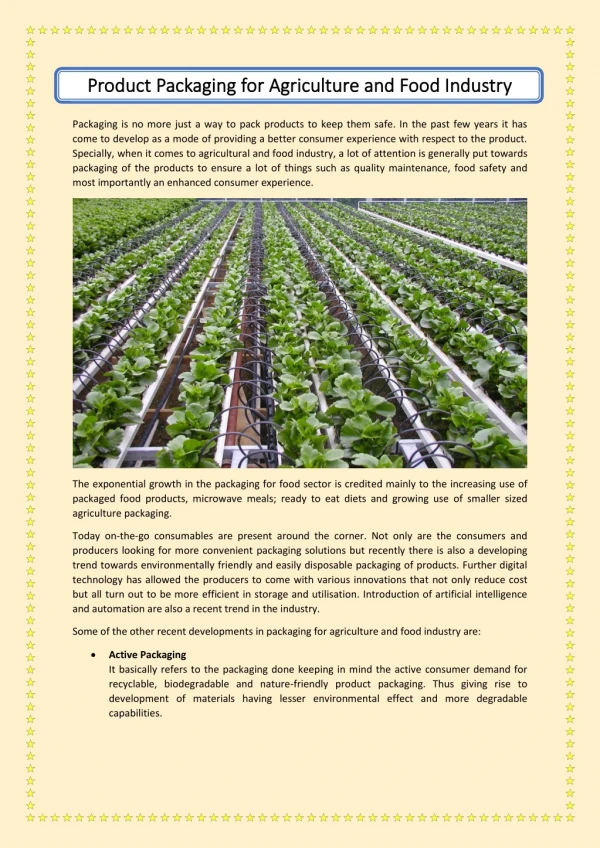
The Hungarian Agriculture • Utilised agricultural area 60 per cent • Utilised agricultural area per capita 0,6 hectare • Dominance of cereal production • Limited orchard and vineyard areas • Decreasing animal husbandry
Agricultural enterprises • 7 800 • Average agricultural area 503 hectare • 71 per cent Crop farming • 11 per cent Livestock farming • 18 per cent Mixed farming • Cattle and pig
Private holdings (1) • 766 000 • Average agricultural area3 hectare • 37 per cent Crop farming • 25 per cent Livestock farming • 38 per cent Mixed farming • Pigs, cattle, sheep, horses
Private holdings (2) • 59 per cent for family consumption • 12 per cent for market • 29 per cent for family consumption and for market
Key characteristics of the Hungarian Food Industry • Decreasing state ownership • Decreasing investment • Reduction of employment • Recreasing productivity
Conclusion • The change-over to the market economy hit the Agriculture and Food Industry • The share of Agriculture and Food Industry in the GDP declined • The share of Agriculture and Food Industry in Employment declined • The transformation process continues • Agriculture and Food Industry should find the place and role in the EU economy