Download
1 / 40
400 likes | 529 Views
Landscape-scale forest carbon measurements for reference sites: The role of Remote Sensing. Nicholas Skowronski USDA Forest Service Climate, Fire and Carbon cycle science Silas Little Experimental Forest . Outline. Background in Remote Sensing

E N D
Landscape-scale forest carbon measurements for reference sites: The role of Remote Sensing NicholasSkowronski USDA Forest Service Climate, Fire and Carbon cycle science Silas Little Experimental Forest
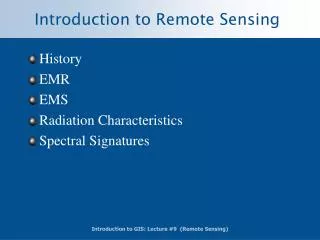
Outline • Background in Remote Sensing • Remote sensing in the context of carbon measurements • Basic LiDAR data processing steps • Focus on LiDAR work at NJ Tier 3 sites and beyond.
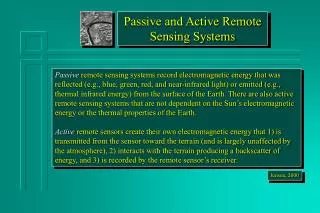
Types of Remote Sensing observations • Passive Sensors – Spectral Reflectance (sun source) • Active Sensors – Reflectance and Echo (sensor source)
Resolution • Spatial Resolution: How small an object do you need to see (pixel size) and how large an area do you need to cover? • Spectral Resolution: What part of the spectrum do you want to measure? • Radiometric Resolution: How finely (precisely) do you need to quantify the data? • Temporal Resolution: How often do you need to measure?
GOES MODIS LiDAR, RADAR Landsat, EO-1 IKONOS, Quickbird Adapted from : Chambers et al. 2007
Remote Sensing in the Context of Carbon Measurements • Land use and land cover Change • Phenological cycles • Canopy chemistry • Crown detection and species identification • Forest biomass • Forest structural attributes
Land Use Change • Landsat TM and Landsat ETM • ca. 30 m vertical resolution • 16 day temporal resolution • 8 spectral bands From: Lathrop et al. 2009
Phenology • MODIS • ca. 1 km vertical resolution • 1 day temporal resolution • 36 spectral bands Monthly phenology (as illustrated by various vegetation indices) for a single MODIS pixel in 2005 at Harvard Forest, MA, USA. Reed et al. 2009
Canopy Chemistry • AVRIS • ca. 17 m vertical resolution • Aircraft-borne • 224 spectral bands Foliar nitrogen and canopy water in Hawaii Volcanoes National Park from AVRIS. Asner and Vitousek (2005)
Individual Crown Delineation • Discrete-return scanning LiDAR • 4 pulses m-2 • Aircraft-borne • “Return Cloud” filtered Lee et al. 2010
Landscape-scale Forest Biomass • Discrete-return scanning LiDAR • 4 pulses m-2 • Aircraft-borne • “Return Cloud” filtered Short et al. Gonzalez et al. 2010 • LiDAR-derived maximum canopy height. • Aboveground live tree carbon
Regional-scale Forest Biomass • Data-fusion approach • LiDAR and Spectral Data Statistical Data Fusion for regional forest height mapping. Kellndorfer et al. 2010
Forest Structural Attributes • Discrete-return scanning LiDAR or full-waveform LIDAR • Varying data intensity • Aircraft-borne or backpack borne Falkowski et al. 2009
LiDAR work at the NJ Tier 3 sites • LiDAR background • Calibration using plot-level data • Landscape-level carbon storage • Change Detection • Characterization of Canopy Structure
Filtering LiDAR returns • “Point cloud” that has individual LiDAR returns as x, y and z co-ordinates
Filtering and Classifying LiDAR returns • Start with a point cloud that has individual LiDAR returns as x, y and z co-ordinates • Using an algorithm we filter these points to find “low” points for a given area, these points are classified as ground.
Filtering and Classifying LiDAR returns • Start with a point cloud that has individual LiDAR returns as x, y and z co-ordinates • Using an algorithm we filter these points to find “low” points for a given area, these points are classified as ground. • Other returns are then classified as vegetation or buildings. Heights are then transformed from height from the sensor to the height above ground.
Statistical Parameters of a cell • Mean Return Height • Maximum Return Height • Percentile Heights • Percent Cover • Kurtosis • Skew • Standard Deviation
Biomass by Land cover type in Burlington and Camden Counties
Multi-Temporal Dataset at the Silas Little Experimental Forest Extent 2005 2004
Unsupervised Classification of CHPs Gypsy Moth Defoliation Typical Oak-Pine Young Pine Regeneration Pitch-Pine Lowland