Download
1 / 18
180 likes | 274 Views
Bell Ringer. In a given time (3 minutes) list as many concepts/topics as you can – topics we have learned about up to today from the beginning of the year…. To be able to…. Draw scatter plot Describe correlation Write down equation of regression line Draw regression line

E N D
Bell Ringer • In a given time (3 minutes) list as many concepts/topics as you can – topics we have learned about up to today from the beginning of the year…
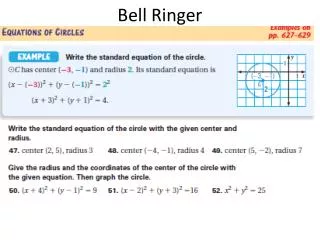
To be able to… • Draw scatter plot • Describe correlation • Write down equation of regression line • Draw regression line • Use the graphing calculator to do all the above • Find mean, median, mode, and range • Interpret stem and leaf plot & box – and – whisker plot • Find 1st, 2nd, 3rd quartile & interquartile range • Read a cumulative frequency graph
On the TI 83… • Given the following data values, enter them into the Lists in your calculator: 1. Find the regression line (line of best fit) xy ( give your values to 3 sig. figs) 2. Sketch the graph from your calculator 3. Comment on the value of r. 4. Predict (estimate) the value of y when x = 50 *** make sure to check if your PLOT 1 is on (go to 2nd and the “Y=” button and turn it on!)
and this is what you should get… y = 6.03x – 10.6 When x = 50, y is approximately 293
Warm up The table below gives the frequency distribution of marks of 40 students. For the given data Cumulative Frequency Table is shown below. MARKSFREQUENCY CUMULATIVE FREQUENCY 0 0 0 10 8 8 20 10 18 30 22 40 40 10 50 50 7 57 60 360 Using the graph to the right: Estimate 1. the median 2. the lower quartile and upper quartile 3. the IQR
DON’T FORGET… • to find any OUTLIERS when creating your box – and – whisker plots • that is: Q1 – 1.5×IQR and Q3 + 1.5×IQR
To be able to… • Find probabilities from a 2 dimensional diagram • Find probabilities using a tree diagram • Find the number of degrees of freedom • Write down the null and alternate hypothesis • Write down the critical value of the test • Determine whether we will accept or reject the null hypothesis.
probability…again Jason drives his car to school 40% of the time and the other time he rides his bike. If he drives his car, there is a 10% chance he will be late. If he rides his bike, there is a 30% chance he will be late. • Make a tree diagram to represent this situation. • What is the probability Jason rode his bike and was late? • What is the probability Jason drove his car and was late? • What is the probability Jason will be late? • What is the probability Jason rode his bike, given he was late? • What is the probability Jason drove his car, given he was late?
: Test for Independence The contigency table below shows the results of motor vehicle accidents in relation to whether or not the traveler was wearing a seat belt. 1. Write the NULL HYPOTHESIS 2. WRITE THE ALTERNATE HYPOTHESIS 3. Find the DEGREES OF FREEDOM. 4. Test at 1% level whether there is a link between accidents and seat belts. WILL WE ACCEPT OR REJECT OUR NULL HYPOTHESIS????
To be able to… • Represent information on a Venn Diagram. • Calculate probability from Venn Diagrams. • Find the number of elements on the Venn Diagram. • Fill in a truth table. • Define converse, inverse, contrapositive. • Write logical symbols in words. • Find the converse of a given conditional statement. • Determine whether a proposition is a tautology or a contradiction.
Venn Diagrams • A coach offered to buy hot dogs for players on his team. Of the 44 players, 28 wanted ketchup, 20 wanted mustard, 14 wanted relish, 10 wanted ketchup and mustard, 11 wanted ketchup and relish, 8 wanted mustard and relish and 6 wanted all three condiments. How many players wanted • Ketchup only? • Mustard but not relish? • Relish but not mustard? • Ketchup and mustard but not relish? • Relish and mustard but not ketchup? • None of the three condiments? • What is the probability that a player wanted mustard given he wanted ketchup?
Logic • What is a tautology? • What is a contradiction? • What is converse, inverse, contrapositive? • What does it mean to be logically equivalent?
To be able to… • Solve problems dealing with functions and trigonometric functions • Solve problems dealing with sequences and series • Solve problems dealing with simple interest & compound interest • Find derivatives • Find equations of tangent lines
Functions • The graph of y = a sin 2x + c is shown, −180 < x < 360, x is measured in degrees. (a) State: (i) the period of the function; (ii) the amplitude of the function. (b) Determine the values of a and c. (c) Calculate the value of the first negativex-intercept.
Sequences & Series… The first four terms of an arithmetic sequence are shown below. 1, 5, 9, 13,...... • Write down the nth term of the sequence. • Calculate the 100th term of the sequence. (c) Find the sum of the first 100 terms of the sequence.
Financial Mathematics Compare the interest that would be received over five year period from these banks. In which bank should Brittany deposit her money? Bank of America: 5% p.a. simple interest TCF Bank: 4% p.a. compounded quarterly Chase Bank: 3% compounded monthly
And some Calculus… Find the equation of the tangent line to the function at x = 4