Download
1 / 1
10 likes | 102 Views
Capital. Percent. Before-Tax. After-Tax. Weighted. Source. Amount. Weight. Cost. Cost. After-Tax Cost. A). GE Cost of Capital. B). C). Short-term Debt. $2,642. 0.60%. 6.3%. 3.7%. .02%. Long-term Debt. $709. 0.17%. 6.7%. 4.0%. .01%. Equity. $429,906. 99.23%. 14.1%.

E N D
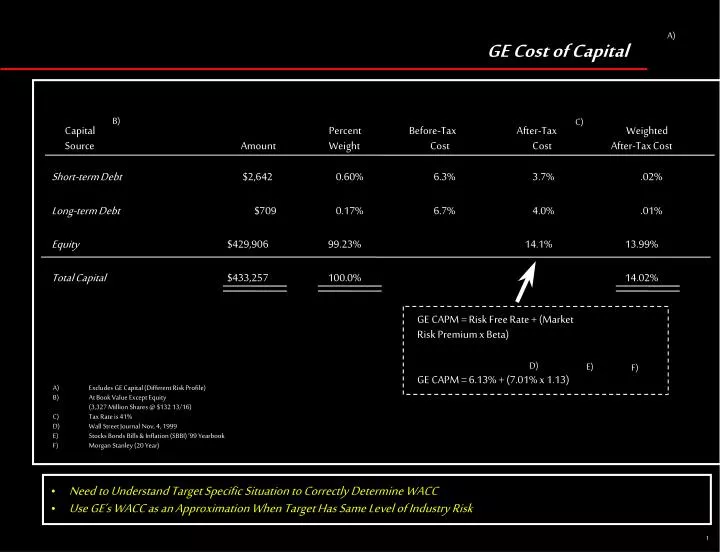
Capital Percent Before-Tax After-Tax Weighted Source Amount Weight Cost Cost After-Tax Cost A) GE Cost of Capital B) C) Short-term Debt $2,642 0.60% 6.3% 3.7% .02% Long-term Debt $709 0.17% 6.7% 4.0% .01% Equity $429,906 99.23% 14.1% 13.99% Total Capital $433,257 100.0% 14.02% GE CAPM = Risk Free Rate + (Market Risk Premium x Beta) D) E) F) GE CAPM = 6.13% + (7.01% x 1.13) A) Excludes GE Capital (Different Risk Profile) B) At Book Value Except Equity (3,327 Million Shares @ $132 13/16) C) Tax Rate is 41% D) Wall Street Journal Nov, 4, 1999 E) Stocks Bonds Bills & Inflation (SBBI) ‘99 Yearbook F) Morgan Stanley (20 Year) • Need to Understand Target Specific Situation to Correctly Determine WACC • Use GE’s WACC as an Approximation When Target Has Same Level of Industry Risk