Download
1 / 26
270 likes | 399 Views
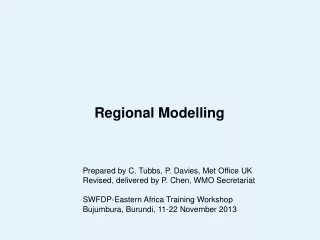
Modelling of regional CO2 balance. Tiina Markkanen. with Tuula Aalto, Tea Thum, Jouni Susiluoto and Niina Puttonen. Contents. Modeling framework in Snowcarbo Models REMO – regional climate model JSBACH – land surface scheme Demonstration of model performance Regional Local

E N D
Modelling of regional CO2 balance Tiina Markkanen with Tuula Aalto, Tea Thum, Jouni Susiluoto and Niina Puttonen
Contents • Modeling framework in Snowcarbo • Models • REMO – regional climate model • JSBACH – land surface scheme • Demonstration of model performance • Regional • Local • Conclusions and future perspectives Finnish Meteorological Institute
Modelling framework in Snowcarbo Models applied: • REgionalclimate MOdelof MPI -M, Hamburg REMO Produce regional climatic forcing • Land surface scheme (LSS) of GCM ECHAM JSBACH Produce regional CO2 balance consisting of assimilation and emissions in ecosystems Finnish Meteorological Institute
Modelling framework in Snowcarbo Relatively high spatial resolution • ~18km High time resolution • 1 hour Stays close to actual weather of target years 2001-2011 • Climate initialised once per day REMO and JSBACH are offline coupled • REMO does not get feedback from JSBACH but interacts with its own surface scheme Finnish Meteorological Institute
Vegetation type classification from remote sensing Land cover classification from remote sensing Anthropogenic and ocean CO2 sources, fires JSBACH CO2 flux Detailed meteorology REMO2008 tracer REMO2008 Indicators of regional CO2 balance Snow data, Phenology, etc. Observed climate (ECWMF) CO2 flux (NEE) field 2D CO2 concentration field 3D Snow data Validation against various data Snow cover and phenology related variables Flux and concentration data Finnish Meteorological Institute
Vegetation type classification from remote sensing Land cover classification from remote sensing Anthropogenic and ocean CO2 sources, fires JSBACH CO2 flux Detailed meteorology REMO2008 tracer REMO2008 Indicators of regional CO2 balance Snow data, Phenology, etc. Observed climate (ECWMF) CO2 flux (NEE) field 2D CO2 concentration field 3D Snow data Validation against various data Snow cover and phenology related variables Flux and concentration data Finnish Meteorological Institute
REMO: forcing and initialisation Regional climate model requires as boundary data • Atmospheric conditions Wind speeds, Temperature, Humidity • Sea surface temperature, ice cover • Surface parameter fields As initial data in addition to those above • Soil temperature and moisture Sources of initial and boundary meteorological data • General circulation models • Re-analysis data products, here ERA-Interim, ECMWF Finnish Meteorological Institute
REMO: basic characteristics • Dynamic core of DWD operational model • Physics and surface model from ECHAM • Surface parameter maps for Surface background albedo, roughness length, vegetation ratio, leaf area index, forest fraction, soil field capacity • Rotated spherical grid Close to rectangular • Resolution applied in Snowcarbo 0.1667° Finnish Meteorological Institute
REMO: surface parameter maps Standard land cover of USGS classified according to Olson cover types (n=100) Parameter values allocated to each Olson type Parameters aggregated from 1km USGS map to maps of resolution of the model In Snowcarbothe USGS map is replaced by National Corine Land Cover (CLC), European CLC and Globcover datasets • Allocations from new land cover classes to Olson ones needed Finnish Meteorological Institute
REMO: influence of land cover – forest fraction Standard USGS land cover National Corine land cover Finnish Meteorological Institute
REMO: In thisprojectruns in forecastmode • Modelinitialised daily at 6pm • Spun-upuntilmidnight in order to let the flowfield to develop into a reasonablestate • Run for 24 consequenthours with hourly output • Weatherstaysclose to observed • Sensitive to meteorologicalboundary • Notverysensitive to surfaceparameterisation Finnish Meteorological Institute
Vegetation type classification from remote sensing Land cover classification from remote sensing Anthropogenic and ocean CO2 sources, fires JSBACH CO2 flux Detailed meteorology REMO2008 tracer REMO2008 Indicators of regional CO2 balance Snow data, Phenology, etc. Observed climate (ECWMF) CO2 flux (NEE) field 2D CO2 concentration field 3D Snow data Validation against various data Snow cover and phenology related variables Flux and concentration data Finnish Meteorological Institute
Modelling framework in Snowcarbo: JSBACH LSS of ECHAM to account for • Surface energy partitioning – e.g. water balance • Carbon cycle In offline coupled mode JSBACH is used to account for ecosystem carbon balance - CO2 exchange Process model Processes described down to as small scale as possible • Limited by computational resources Finnish Meteorological Institute
JSBACH: characteristics • 4 tiles, i.e. 4 PFTs (plant functional type) for each grid cell • Photosynthesis of C3 and C4 plants • Radiation in canopy • Carbon storages in soil and vegetation Q10 approach for soil decomposition • LAI (leaf area index) dynamics described with four phenology models Finnish Meteorological Institute
JSBACH: parameterisations for PFTs • Phenology • Photosynthesis • Carbon storage sizes • Decomposition rates of carbon storages • Albedo for NIR and VIS • Roughness length, LAImax, etc. • Dynamic vegetation • Nitrogen cycle Tropical broadleaf evergreen trees Tropical broadleaf deciduous trees Temperate broadleaf evergreen trees Temperate broadleaf deciduous trees Coniferous evergreen trees Coniferous deciduous trees Raingreen shrubs Deciduous shrubs C3 grass C4 grass Tundra Swamp (not used) Crops Glacier PFT distribution is revised with more detailed land cover products Finnish Meteorological Institute
ECHAM5 bottomlayer JSBACH radiation Lightabsorbtion in canopy fAPAR Thermal and hydrologicalconditions Photosynthesis (unlimitedwater) gc unstressed ECHAM soilmodel CO2concentration gc stressed Photosynthesis (waterlimited) H & LE Gross assimilation, Rd Carbonpoolmodel + landusechange CO2flux NPP phenology Albedo & roughnesslength LAI Landboundaryproperties
JSBACH REMO radiation Lightabsorbtion in canopy fAPAR Thermal and hydrologicalconditions Photosynthesis (unlimitedwater) gc unstressed ECHAM soilmodel CO2concentration gc stressed Photosynthesis (waterlimited) H & LE Gross assimilation, Rd Carbonpoolmodel + landusechange CO2flux NPP phenology Albedo & roughnesslength LAI Landboundaryproperties Offlinecoupling in Snowcarbo
Vegetation type classification from remote sensing Land cover classification from remote sensing Anthropogenic and ocean CO2 sources, fires JSBACH CO2 flux Detailed meteorology REMO2008 tracer REMO2008 Indicators of regional CO2 balance Snow data, Phenology, etc. Observed climate (ECWMF) CO2 flux (NEE) field 2D CO2 concentration field 3D Snow data Validation against various data Snow cover and phenology related variables Flux and concentration data Finnish Meteorological Institute
Lightabsorbtion in canopy Photosynthesis (unlimitedwater) ECHAM soilmodel Photosynthesis (waterlimited) Carbonpoolmodel + landusechange phenology Landboundaryproperties JSBACH REMO in tracermode radiation fAPAR Thermal and hydrologicalconditions gc unstressed CO2concentration gc stressed H & LE Gross assimilation, Rd NPP CO2flux Albedo & roughnesslength LAI
Lightabsorbtion in canopy Photosynthesis (unlimitedwater) ECHAM soilmodel Photosynthesis (waterlimited) Carbonpoolmodel + landusechange phenology Landboundaryproperties Observed climate (ECWMF) Anthropogenic and ocean CO2 sources, fires JSBACH REMO in tracermode radiation fAPAR Thermal and hydrologicalconditions gc unstressed CO2concentration gc stressed H & LE Gross assimilation, Rd NPP CO2flux Albedo & roughnesslength LAI
REMO tracer run Uses the same meteorological initial and boundary data as the first REMO run Additionally • Gets CO2 flux estimates of vegetation from JSBACH • Utilizes prescribed anthropogenic and land fire emissions from a database • Ocean sources from a database • Requires background CO2 concentrations Produces 3D CO2 concentration fields Finnish Meteorological Institute
Demonstration of model performance JSBACH was forced • regionally with REMO derived climatic forcing Forecast mode for climate model Standard landcover in bothmodels Defaultcarbonstorages in JSBACH • for fluxmeasurementsites Sodankylä and Hyytiälä About a decade of measurements as climaticforcing 1000 years spin up for soilcarbonstorages with presentclimate Finnish Meteorological Institute
Demonstration of model performance Regional daily average NEE <startanimation> Finnish Meteorological Institute
Demonstration of model performance Daily NEE at Sodankylä Scots pine site (gm-2s-1) Finnish Meteorological Institute
Demonstration of model performance Daily NEE at Hyytiälä Scots pine site (gm-2s-1) Finnish Meteorological Institute
Conclusions and future perspectives • Assimilation and emissions of CO2 in ecosystems explicitly modeled • Offline coupled REMO – JSBACH framework produces CO2 balance in high temporal and in relatively high regional resolution • National level estimates of CO2 balance can be extracted from the regional maps To be done • Evaluation of the results against CO2 flux and concentration data • Adjustment of the relevant parameters in order to produce better regional estimates Finnish Meteorological Institute